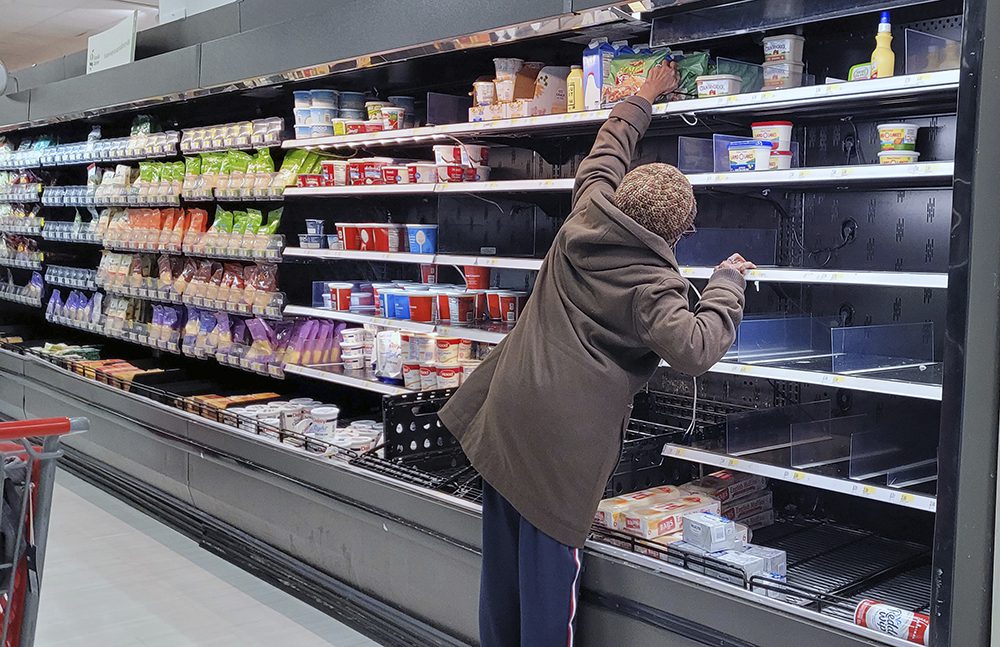
Don’t be surprised if inflation, which hit a 40-year high of 7.5% in January, spikes even higher over the next few months as the U.S. government’s massive response to the coronavirus pandemic continues to ripple through the economy.
Inflation will likely ease in the second half of the year, but a drop to pre-pandemic levels is not in sight yet, according to a pair of economists who shared their outlook for 2022 and beyond at a virtual conference hosted by the Fisher Center for Real Estate and Urban Economics at UC Berkeley’s Haas School of Business this week.
“We way overdid it” with monetary and economic stimulus, said Kenneth Rosen, chair of the Fisher Center and a Berkeley Haas professor emeritus. He gave Congress credit for crafting emergency programs—such as enhanced unemployment, stimulus payments and Paycheck Protection Program loans—in 2020, but “I do think the stimulus in 2021 probably was unnecessary and should have been more targeted.”
Once the economy began to reopen, those stimulus programs quickly boosted demand for goods, while manufacturing, transportation and labor-force disruptions constrained supplies. The upshot: Inflation hit 7% in December and 7.5% in January, the highest since February 1982. Rosen said the “slow-moving” Federal Reserve waited too long to curb skyrocketing inflation by raising interest rates.
Inflation could hit 9%
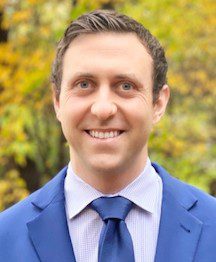
That will change this year, when the Fed finally starts raising rates and fiscal stimulus begins to wear off, said Rosen and co-panelist Richard Barkham, global chief economist with CBRE.
Rosen sees inflation hitting 8% to 9% in a few months, before falling to 4 to 5% by year end. Chief executives he has spoken with recently said they are raising prices. They have labor problems and “don’t think it’s going to end quickly.”
Co-panelist Richard Barkham, global chief economist with CBRE, thinks inflation will peak at 9% in the first half of the year and drop to 3% to 4% by year end as kinks in the supply chain ease up and the reopening of schools and day care facilities let more people re-enter the workforce. But inflation will be “higher and more messy than people currently expect.”
Both economists expect the Fed will raise the short-term federal funds rate, now at 0.25%, by a quarter point four or five times this year. Barkham sees two more hikes next year, Rosen sees four.
Inflation will fall, but not to target rate
The two experts also agreed that after the transitory effects of the pandemic wear off, inflation will fall—but not to the Fed’s 2% target rate because the aging population and immigration constraints will keep an upward pressure on wages. A shift away from fossil fuels along with super-tight labor markets could also keep energy prices a bit higher, Barkham said.
Rosen said the U.S. economy will likely grow 3.5% to 4% this year as international tourism, conventions, and other sectors reopen. Also, individuals and businesses still have about half of the $5 trillion in fiscal stimulus doled out since 2020 sitting idle. Much of that will be spent this year and next, Rosen and Barkham agreed.
Immigration constraints will curb growth
Longer term, neither economist sees growth exceeding 2% annually unless the government bolsters immigration.
“Immigration and inter-regional migration was always the secret weapon of the U.S. economy,” said Barkham, who is a British citizen working in Boston. But legal and illegal immigration have fallen drastically in recent years, due to policies enacted during the Trump administration and Covid-related travel restrictions.
The United States should promote immigration, “but also be more aware of the actual and perceived distributional effects on income groups that have done poorly in the era of globalization,” Barkham said, noting that it’s tricky to put into practice. “I’m not particularly optimistic that we will see that increase in immigration” in the near and medium term. That means economic growth will have to come almost entirely from productivity gains, he said.
Rosen called immigration “the number one thing we can do” to promote long-term economic growth.
As for the stock and bond markets, expect more gyrations. Rising interest rates “will cause indigestion in the financial markets,” Rosen said.
More pain in 2023
Barkham said the real pain may not hit until 2023. Even if you had six rate hikes in 2022, “you still end the year with negative real interest rates,” which means short-term rates will be lower than the inflation rate. Real rates drive the economy and real estate markets, he said, and while they won’t be as deeply negative as they are now, “they will still support higher asset values.”
But by 2023, real interest rates will turn positive, and recent history has shown the U.S. is not very tolerant of them. When rates rose in 2018, there were “two big stock market hiccups,” Barkham said. “The Fed doesn’t want a major correction, but a certain amount of chop is all part of the process of moving out of these emergency policy settings.”


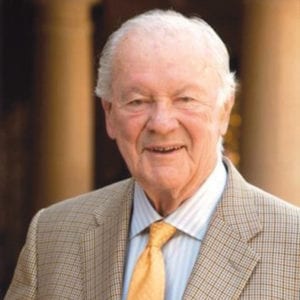 Edward Hinshaw “Big Ed” Peterson, 84, succumbed to MDS on Feb. 17 at his home in Indian Wells, California. Peterson enjoyed a lifelong career in real estate, selling and leasing what he said was “almost every building in the San Francisco financial district.” He also led fundraising efforts for Berkeley and served as chairman of the UC Berkeley Foundation and later as trustee emeritus.