Political Ideology and U.S. Electric Vehicle Adoption
New Energy Institute working paper measures EV concentration in the most Democratic counties.
The prospect for electric vehicles as a climate change solution hinges on their widespread adoption across the political spectrum. Policymakers envision EVs reaching two-thirds of U.S. new vehicle sales by 2032, so even ubiquitous adoption in Democratic areas like Cambridge, MA will simply not be enough.
In a new Energy Institute working paper, Jing Li, Katalin Springel and I examine the correlation between political ideology and U.S. EV adoption. Using state-level and county-level data on new vehicle registrations from 2012-2022, we measure the degree to which EV adoption is concentrated in the most Democratic areas, and how this concentration has changed over time.
We think it is high time for such a study. Many new technologies start off as niche products, appealing mostly to a subset of customers. But it has now been 14 years since Nissan introduced the Leaf, and 16 years since Tesla introduced the original Roadster. Moreover, there are now over 100 different EV models available. Enough time has passed — one might think — for the U.S. EV market to have broadened considerably.
Strong Correlation
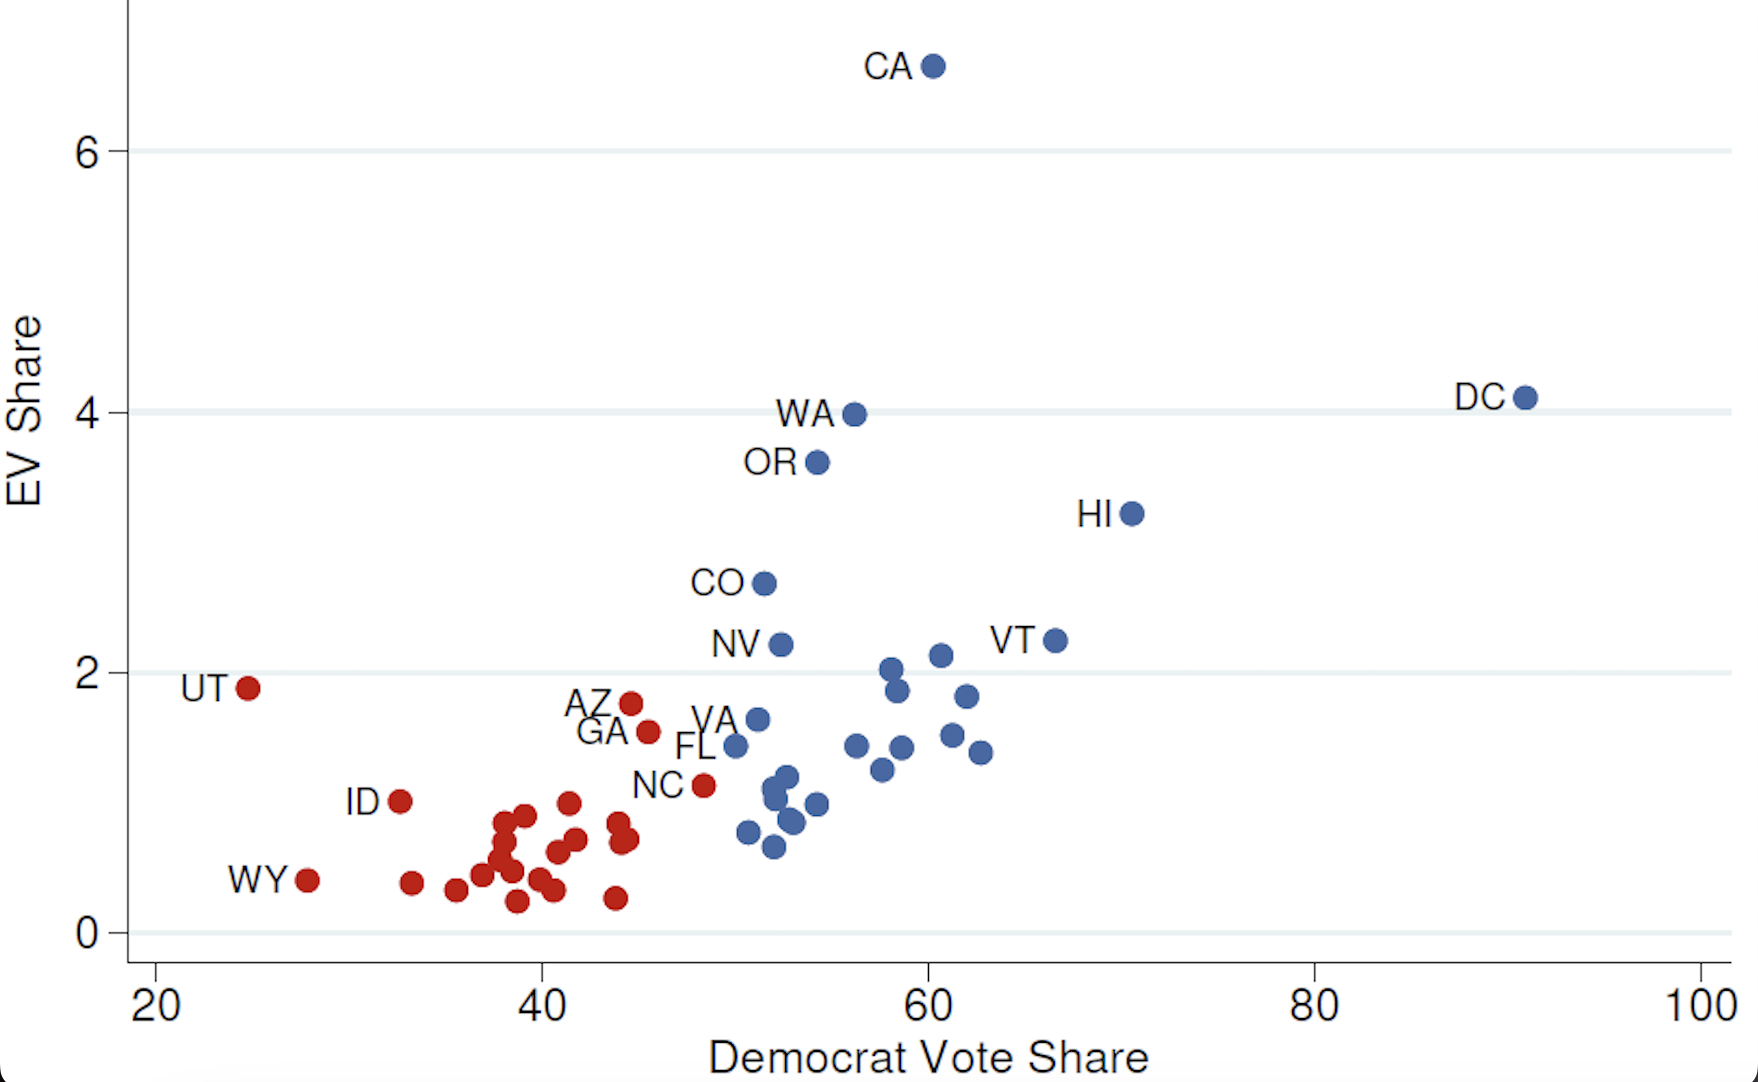
The figure below has 51 observations, one for each state plus Washington DC.
—
The horizontal axis is the Democrat vote share from the 2012 U.S. presidential election. (In the paper we repeat the analysis with 2016 and 2020 vote shares, and results are very similar.)
The vertical axis is EVs as a share of all new vehicles 2012-2022. These data come from the Experian North American Vehicle Database, and describe all new U.S. vehicle registrations including both sales and leases. We define EVs as including both battery EVs and plug-in hybrids.
Over this 11 year period, EV adoption was highest in California, with EVs representing over 6% of all new vehicles registered. The three states on the West coast (CA, WA, and OR) all have high Democrat vote shares and high EV adoption. But even excluding those three states there is still a strong positive correlation with households in majority Democrat states (in blue) much more likely to adopt an EV than households in majority Republican states (in red).
Enduring Correlation
The figure below shows separate scatterplots for each year 2012 to 2022.

—
The figure reveals the explosive growth in EV adoption. In the early years, EV shares were near 0% in most states, and below 5% everywhere. Adoption increases sharply year-after-year with particularly notable growth in 2018, 2021, and 2022. By 2022, EVs represent more than 5% of the market in most Democratic states, while still less than 5% in most Republican states.
Surprisingly, we find no evidence that the correlation is decreasing over time. With these state-level scatterplots, for example, we find a correlation of 0.60 in 2012 and 0.64 in 2022.
County-Level Data
The paper next turns from state-level to county-level. The state-level patterns provide a good starting point but they obscure rich variation within states that can shed additional light on this relationship.
The table below describes the concentration of U.S. EV adoption in the most Democratic counties. In 2012, about half (48.4%) of all new EVs went to the top 10% most Democratic counties, about one-third (35.9%) went to the top 5%, almost one in twenty (4.5%) went to the top 1%, and seven out of every ten (70.0%) went to counties with a Democrat majority.

—
The pattern fluctuates across years, but with no clear overall trend. The concentration of EVs in the most Democratic counties increases somewhat during the middle of the period, and then decreases again toward the end. Such that by 2022, it looks a lot like it did in 2012, with about half of all new EVs going to the 10% most Democratic counties, and about one-third going to the top 5%.
The paper provides additional analyses. Overall, we find little evidence that the U.S. EV market is broadening across the political spectrum.
Alternative Explanations
The most Democratic counties tend to have high household incomes, high population densities, and high gasoline taxes, three factors that have been shown in previous studies to matter for EV adoption. Thus one might reasonably ask whether the patterns above reflect these other factors — rather than political ideology.
The paper thus next examines the correlation between EV adoption and political ideology while controlling for one or more of these other factors. For example, the figure below shows that a strong correlation remains even after restricting the sample to counties above the 90th percentile for population density.

—
We also show, using regression analyses, that the effect of political ideology remains strong and statistically significant after controlling for household income, population density, and gasoline prices. There is still more we can do to disentangle political ideology from other factors, but our analysis so far points to political ideology having a separate and distinct effect, above-and-beyond these other factors.
Conclusion
We still have a lot of work to do. Just since posting the paper less than 3 weeks ago, we have already received a ton of useful feedback. For example, one reader helpfully pointed out that fourteen states have adopted California’s zero emissions vehicle (ZEV) mandate, and we are working on additional analyses that control for ZEV, as well as reporting results separately for ZEV and non-ZEV states.
We are also working on analyses comparing “conspicuous” versus “inconspicuous” EVs – think Tesla versus Volkswagen e-Golf – to try to shed light on EV adopters’ intrinsic versus extrinsic motivations. For intrinsic we have in mind the idea of “warm glow”, i.e. that households want to “do their part”, and for extrinsic we have in mind signaling to others.
But the results thus far point to a strong and enduring correlation between political ideology and U.S. EV adoption. The EV market has grown in scale dramatically over this time period, yet we find that, at least through 2022, new registrations continue to be overwhelmingly concentrated in the most Democratic counties.

—
Keep up with Energy Institute blogs, research, and events on X @energyathaas
For more see, Davis, Lucas, Li, Jing, and Springel, Katalin. “Political Ideology and U.S. Electric Vehicle Adoption,” Energy Institute Working Paper, (October 2023), WP-342.
Suggested citation: Davis, Lucas, “Political Ideology and U.S. Electric Vehicle Adoption”, Energy Institute Blog, UC Berkeley, November 6, 2023, https://energyathaas.wordpress.com/2023/11/06/political-ideology-and-u-s-electric-vehicle-adoption/
Categories
Lucas Davis View All
Lucas Davis is the Jeffrey A. Jacobs Distinguished Professor in Business and Technology at the Haas School of Business at the University of California, Berkeley. He is a Faculty Affiliate at the Energy Institute at Haas, a coeditor at the American Economic Journal: Economic Policy, and a Research Associate at the National Bureau of Economic Research. He received a BA from Amherst College and a PhD in Economics from the University of Wisconsin. His research focuses on energy and environmental markets, and in particular, on electricity and natural gas regulation, pricing in competitive and non-competitive markets, and the economic and business impacts of environmental policy.

The Inflation Reduction Act directs a disproportionate amount of its ample clean tech dollars to red states, which will hopefully accelerate EV adoption in them. Having had a close call with not finding a charger last month in the purple state of NH, I had my first personal range anxiety experience with my EV rental. (I own a Prius.) And it was in the Concord-Manchester area, not in the boonies near the Canadian border. The U.S. needs a massive build out of EV charging options, as highlighted here: https://www.nytimes.com/2023/10/19/climate/ev-range-anxiety-a-case-study.html?searchResultPosition=19
There’s an insightful piece in today’s NYT on the somewhat sluggish sales of EVs and the tendency for drivers to lease. https://www.nytimes.com/2023/11/08/business/energy-environment/electric-vehicles-biden.html
A few key findings:
Spotty availability of fast chargers is shaping up as one of the main reasons that people hesitate to buy electric vehicles. Most owners charge at home. But on longer voyages, they need chargers capable of charging a car in half an hour to 45 minutes.
Ms. Buckberg and other researchers, like Chad Bown of the Peterson Institute for International Economics, have noted one big way the law has changed the electric-vehicle market: It has pushed consumers toward leasing, not buying. That’s because the Treasury Department allowed leased vehicles to be treated differently under the law’s domestic content requirements. Companies like Hyundai and Kia are able to capture the full $7,500 credit for their electric models — and pass that on to consumers — if they lease them.
“I think it’s going to be a long time before you see your local waitress come in and buy an E.V. — they’re just too expensive,” said Rhett Ricart, the chief executive and owner of the Ricart Automotive Group in Columbus, Ohio, and a former president of the National Automobile Dealers Association.
We’re planning on leasing our first EV. We tend to own cars for more than a dozen years, but leasing affords us the opportunity to upgrade as the technology advances and leaves the valuation risk to the auto companies. A friend bought his leased EV for less than half the cost new. This study needs to incorporate leased vehicles to be more on point.
Availability of utility incentive program for EV purchase; availability of EV parking/charging stations; and climate zones (mild weather vs. severe weather) all also contribute to the consumer’s decision-making on EV purchase. Impacts of these factors deserve being controlled and investigated.
Never mind The Red or Blue. It is the Green (money) that makes EVs either more expensive or less expensive to gasoline powered cars. Even in Blue states, if the commute is less than 50 miles per day, EV ownership is only a status symbol, not good economics. Housing prices force blue state commuters to live farther from the work hubs so longer commutes make EV ownership a better deal than ICE ownership. I drive less than 50 miles per week or 2,400 miles per year in California, so an EV is not for me. I like my luxury sedans and Tesla’s are so cheap and lack amenities I like on my car and other EV brands are just too pricey.
An analysis of California counties reveals a few inconsistencies with this narrative. For example, among LA counties, Orange County (32% in Q2’23) has the highest EV adoption rate among new vehicle purchases, despite voting much less frequently for Biden in 2020 than surrounding counties (~26%). In the Bay Area, Santa Clara and Alameda counties best San Francisco and Marin (not by much). Placer county is also a bit of an anomaly, with a Q2 2023 adoption rate of 26% despite voting for Trump in 2020 and being on balance more rural.
This paper does not control for some significant variables, such as price of electricity, availability of charging stations, lack of population density (i.e. are people in rural areas more or less likely to own an EV), distance to nearest EV dealership or EV mechanic. Type of vehicle dominate in an area seems relevant. Of the 100 EV models, how many are sedans (a declining product) vs SUV or pick-up. Do EVs have a larger market share in sedans than SUVs.
I’ve only perused the paper so I may have missed the authors addressing the substitutability of EVs for ICE vehicles. Most EVs so far have been cars or small SUVs. Full-size truck and larger SUV EVs are relatively new. The word “truck” doesn’t appear in the paper, despite rural and conservative Americans’ affinity for them. For these drivers, there haven’t been plausible substitutes for the type of vehicles they prefer. I think we see some of this in Appendix Table 19, where the Ford F-150 Lightning, Rivians, Jeeps, and the Lincoln Aviator are notable.
Lucas, IMO linking EVs to political ideology is problematic:
• Democratic voters tend to live in more temperate, coastal areas. EVs are have better mileage and range in temperate areas.
• Democratic voters also tend to live in urban areas. Access to charging stations (and home chargers) is better in urban areas.
• New cars from the most popular electric car brand (Tesla) are sold and maintained at company-owned outlets. Outlets are concentrated in urban areas.
There may be a perception of political ideology because of these initial conditions, and the perception may have become an incentive. I don’t believe it started off that way.
I think this paper presents a somewhat misleading picture of potential EV adoption. Alpine County is not equivalent to LA County in importance to national EV adoption. The top 100 counties contain 43% of the U.S. population but are only 3% of the counties. As your paper notes, the counties are dominated by Democratic leaning voters.
https://www.proximityone.com/cty100.htm
Click to access Ch4GARM.pdf
The technology is being adopted more readily in urban areas first—this has been the story for almost every new non-agricultural technology over the last two centuries. In addition the technology has been characterized by range limitations that make it particularly unattractive for rural areas which lean decidedly Republican. And one other important factor – pickups are the largest selling model in most red states, vs autos in many blue states. There are few if any EV pickups yet, so there hasn’t been as much of an opportunity to buy the right vehicle in many states.
https://www.visualcapitalist.com/the-best-selling-vehicles-in-america-by-state/
https://www.autoweek.com/news/trucks/a38752901/most-popular-vehicles-sold-by-state/
https://www.jdpower.com/cars/shopping-guides/most-popular-vehicles-sold-by-state
A couple more observations from the tables:
– Table 3 appears to show a declining share of EV adoption in Democratic counties. That seems to contrast with Table 4 and Appendix Tables 4 & 5. Not sure how to understand the contrast.
– Table 5 and Appendix Table 7 show vote share explaining only 6% of variation. Income explains 10%. The interesting one is that density has almost no explanatory power—there is likely multicollinearity between vote share and density—more dense counties are more likely to be Democratic. And its much easier to own an EV in a denser county.
So I see two different conclusions. First, a large plurality of the U.S. population is in communities that have the highest adoption rates of EVs, which may bode well for overall adoption. Second, these results are likely biased by the current technology limitations that restrict adoption in Republican leaning rural counties.
Given that Democrats have won the majority of votes in most presidential elections since 1992 (2004 being the slight exception) and population is concentrated in the largest 150 counties which are predominantly Democratic, I’m not sure that there’s a big reason for concern. Of course EVs are going to be adopted more rapidly in urban areas.
The prospect of saving anyone from Climate Change by transitioning to EVs is a terrible institutional hoax. We should move off the flood plains first…
Great Point. Installing Solar on one’s roof is also a better idea being the home uses more energy than cars. My home uses 40 kilowatt hours a day or 1,200 kilo watt hours per month. that is the equivalent of driving 3,600 miles per month in an EV or ICE car. When I go “all Electric” and eliminate the Natural Gas, my average daily electrical usage will be more like 60 kilo watt hours per day or 1800 kilo watt hours per month or the equivalent of driving 5,400 miles per month.