Distribution Costs and Distributed Generation
We need to get a handle on distribution costs as we get serious about electrification.
(This post is co-authored with Duncan Callaway)
Our household gets unusually excited about power system infrastructure. We reroute road trips to check out high voltage transmission towers. Our photo album includes pictures of our kids posing with transmission insulators.

Recently our dinner table conversations have been wandering into the topic of distribution infrastructure: conductors, transformers, and substations. You might think this stuff is a bit of a snooze (our kids share this sentiment). But this topic is increasingly important.
For one thing, the amount that utilities are spending every year on distribution system costs is escalating fast. And we have some big decisions to make about where to locate new renewable energy investments (think solar and storage) and new loads (think heat pumps and electric vehicles). How we account for distribution system costs when designing the grid of the future could significantly impact these choices.
So let’s dig into what we know — and what we don’t — about distribution system costs.
Distribution costs are increasing
Every year, major U.S. electric utilities file public expenditure reports. These data aren’t perfect. They only represent about 70% of total US electric load. But they do provide a window into utility spending trends. The chart below shows total annual distribution expenditures (inflation adjusted) by major spending category:
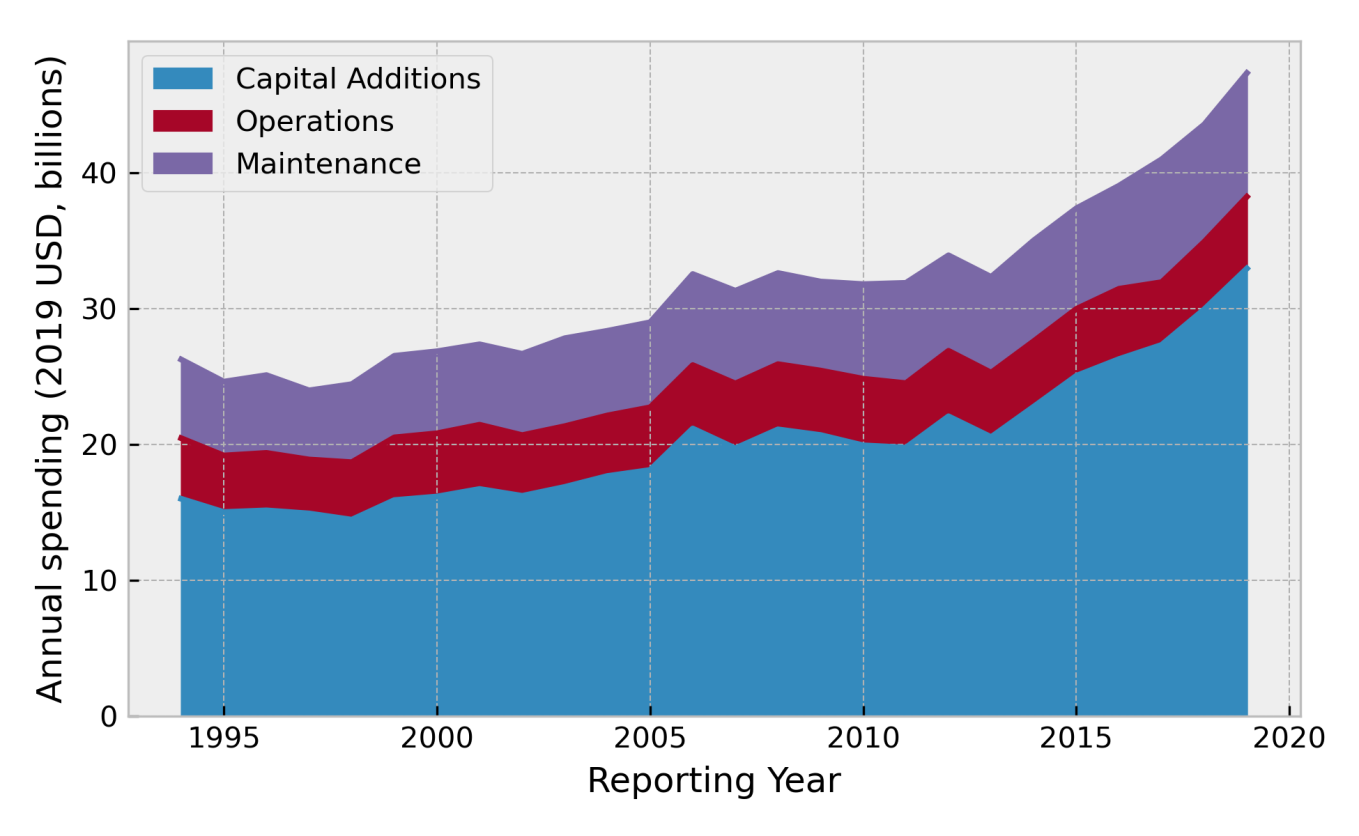 Source: FERC Form 1. These are annual expenditures reported by over 250 US utilities.
Distribution expenditures have been rising over this whole period. But something changed in the last few years. Between 2014 and 2019, capital investments in distribution infrastructure rose 65%! What the heck could be happening? Let’s unpack two possible explanations.
More customers? (No) Looking across utilities, a big driver of distribution system cost variation is the number of connected customers. Cost increases over time could reflect expansions and upgrades to serve an increasing number of new customers. But the total number of connected customers has only increased 6% from 2014 to 2019. So real distribution costs per customer are also increasing (particularly among the California utilities).
 Notes: Real annual distribution spending per customer reported by over 250 US utilities. Half of all utilities fall in the range defined by the “boxes”. Approximately 99 percent fall within the “whiskers”. California utilities are highlighted for our California readers.
Increasing peak demand? (Nope) Utilities could be making more distribution system investments to keep up with peak demand. But peak demand for grid electricity (net of behind-the-meter solar) has been declining on average in recent years.
 Notes: summarizes real annual distribution spending per kW of peak demand reported by over 250 US utilities. 50 percent of utilities fall in the range defined by the “boxes”. Roughly 99 percent fall within the “whiskers”.
You can see that utility distribution spending is increasing per kW of peak demand. This is particularly true for the California utilities. If rooftop PV can reduce distribution costs, it’s not showing up in these data.
The bottom line is that distribution spending is on the rise across the country, and we can’t explain it with growth in customers or demand alone.
What we don’t know about distribution costs could cost us.
In our own research and past blogs, we (and Severin and Lucas) have argued that distribution costs can’t matter much when making a case for distributed solar. But we want to take a minute to think about how distribution costs could matter in a different situation — one where we’re electrifying new loads — to highlight the importance of getting good estimates of future distribution costs.
Consider this thought experiment that adds electrification to the mix. Suppose we anticipate a growing number of electric cars (EVs). Let’s assume we’re going to build more solar — somewhere — to charge them. And assume we have the technology to charge in perfect unison with output from the solar (a strong assumption). This would likely mean workplace charging, at times when commercial distribution circuits are nearing peak demand. We’ll have to pay to expand the capacity of those circuits to make this scenario work if the solar is utility-scale, but not if it’s located where the EVs are charging.
In California, E3 estimates that avoided costs — coarsely at the utility zone level — range between $15 and $168 per additional kW per year in 2019. A year of production from 1 kW of PV, depending on location, would get you about 1,500 kWh per year. That works out to between 1 and 11 cents of added distribution costs per kWh of solar delivered to our cars in this simple scenario, if it’s coming from far away.
This 2019 Lazard report estimates the unsubsidized levelized cost for grid-scale solar at 4¢/kWh. Using this estimate, and the distribution cost estimates, our clean car scenario would cost between 5 and 15¢/kWh if we choose the utility scale solar path today.
Lazard also estimates residential rooftop solar costs at 20¢/kWh, and larger-scale distributed solar (commercial/industrial rooftop or community-scale) solar at 11¢/kWh. If these distributed options mean we can avoid the distribution upgrade costs in our simple thought experiment, residential rooftop solar still costs more than utility scale and its associated distribution costs. But larger scale distributed options could possibly pencil out.
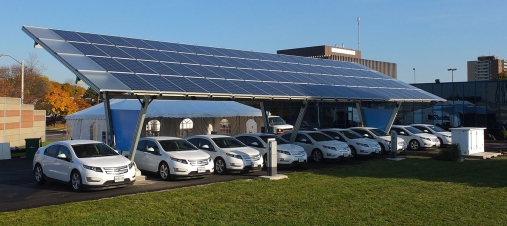
Source: EVs charging while you work
This rough calculation is designed to show how distribution costs could steer decisions about where we build electrified load and distributed generation. Obviously, there are a lot of caveats and complications that our simple example ignores. For example, in the distributed scenario it might be necessary to upgrade part, but not all, of the distribution system in order to share solar between locations. This all goes to show why it’s important to build distribution cost considerations into the state-of-the-art planning models we are using to plan a greener grid.
Some recent studies are trying to tackle this challenge — for example this one from Vibrant Clean Energy and this one from researchers at Princeton. However if you dig into the details of these studies, you’ll find they’re using long-term historical trends in distribution spending (going back at least 25 years) to estimate average distribution capacity expansion costs per kW. You’ll also find that these studies are using total capital investments in distribution grids, rather than the marginal or incremental costs of adding a new kW of capacity.
The devil’s in the (distribution system) details
A host of factors (low interest rates + generous authorized rates of return?) could be driving distribution spending growth. At least some of this spending rise has been attributed to concerted efforts to overhaul the nation’s aging distribution grid. If that’s the major driver, perhaps spending will settle back down in the future.
Whatever’s driving changes in distribution spending, we need to get a handle on it. And figure out how to account for the going-forward distribution cost implications of big changes to electricity consumption. The distribution system may not be the most exciting piece of the greener grid planning puzzle, but it’s critically important to understand it better.
Keep up with Energy Institute blogs, research, and events on Twitter @energyathaas.
Suggested citation: Fowlie, Meredith and Callaway, Duncan. “Distribution Costs and Distributed Generation” Energy Institute Blog, UC Berkeley, February 8, 2021, https://energyathaas.wordpress.com/2021/02/08/distribution-costs-and-distributed-generation/
Categories

Increased distribution costs are, plain and simple, the result of distributed, renewable generation. Topaz, a massive solar farm installed in the middle of California’s Carrizo Plain, for example, required:
“… a new PG&E switching station to PG&E’s existing Morro Bay-Midway 230–kV transmission line; and the aforementioned PG&E switching station that interconnects the Project to PG&E’s existing transmission line. After construction, PG&E would own and operate the switching station.
Eight to twelve miles of overhead 34.5–kV high-capacity collection system lines, with two to four circuits each, would connect the power output from each of the solar arrays to the on-site Project substation. Wooden poles approximately 43 feet high would support these overhead lines.
The Project substation would collect the output and transform it from 34.5 kV to 230 kV. The substation would occupy approximately 4.5 acres and would be adjacent to the PG&E switching station, where the 230–kV output of the substation would be connected and delivered to the Morro Bay-Midway 230–kV transmission line.
The new PG&E switching station would be adjacent to the existing PG&E Morro Bay-Midway 230–kV transmission line. The Morro Bay- Midway 230–kV transmission line traverses the Project site just south of the PG&E switching station. Two new 100- to 125-foot-high double-circuit lattice steel transmission towers and four steel poles would be installed to accommodate the looping of PG&E’s 230–kV line into the switching station. The towers and poles would be within or adjacent to the existing PG&E transmission line right-of-way as well as located on either side of the new PG&E switching station to position the transmission conductors for proper ingress and egress to the station. Construction of the interconnection between the existing Morro Bay– Midway 230–kV line and the new PG&E switching station would be undertaken by PG&E.
Topaz has interconnection agreements in place for the first 400 MW of Project capacity. The California Independent System Operator has determined that network upgrades would be required to accommodate the Project’s remaining 150 MW, as well as other generation projects in the region. Network upgrades could include the reconductoring of the 230–kV transmission lines between the new PG&E switching station and the Midway Substation.”
Click to access Pages-from-Topaz-FEIS-Volume-II-Appendices_A-D_PDF-Version.pdf
These are not complicated principles of physics. First there’s the issue of distance: generating electricity where there are no people, and getting it to customers in urban areas, requires a lot of wire. Then there’s the issue of capacity: existing transmission was designed in radial topology, to efficiently transfer power from centralized power stations outward. Trying to push energy backward on it without expensive retrofits, from thin wires to thick ones, will cause the thin ones to melt from their towers (literally).
All of these lessons were learned half a century before solar panels or wind turbines existed. Possibly California system planners skipped Electromagnetism 407 in college (substituted Introduction to Marijuana Cultivation?), but attempting to using solar and wind to power a modern electrical grid is asking – no, begging – for failure. It’s why Germany has the most expensive electricity of any non-island country in the world, and they’re not even halfway there.
Is there a physicist, or an electrical engineer in the house? No, just “Lazard”, an investment bank making $billions from the sale of expensive renewables hardware, to states and countries who apparently don’t know any better. Ignorant California renewable advocates are getting exactly what they deserve, and it will only get worse.
There are ways to deal with these problems using distributed resources, especially storage, no? And I don’t just mean batteries.
But utilities can’t make money using distributed resources. So, should we non-physicists ignore this very real human problem? I’d guess it’s as hard to solve, or harder, than the physics.
A famous quote by Upton Sinclair goes here; I’m sure you’re smart enough to figure out what it is.
“There are ways to deal with these problems using distributed resources, especially storage, no? And I don’t just mean batteries.”
There is no way to generate electricity more reliably, for more customers, more efficiently, and more cost-effectively using distributed resources. The simple reason relates to economies of scale: if you are making and selling the same product to a lot of people, you can nearly always do it best by manufacturing in bulk. Broken into many pieces, your job suffers from duplication of effort. Duplicating the same process in several locations requires more labor, energy, machinery, and resources.
“But utilities can’t make money using distributed resources…”
Yes, but solar panel and wind turbine developers, natural gas vendors, and grid-scale battery entrepreneurs can’t make money without them.
It all depends on our goal. If the goal to create as many high-paying jobs as possible, distributed resources win hands-down – but at the expense of affordable electricity (expensive electricity is a very human problem). If our goal is to provide the best, most affordable electrical service to the most people, we don’t need as many jobs. We don’t consume as much fuel or use as much land. We don’t need as much equipment, or maintenance. Most importantly, we don’t create as many emissions.
Nuclear energy generates electricity more reliably, for more customers, more safely (yes, more safely), more efficiently, more cost-effectively, and more cleanly than any other source. It doesn’t take much smarts to figure it out, but maybe some high school physics and years of working in environmental causes helps.
Carl, I agree with you *if* you ware thinking about a unitary product. But there are co-products. Homes need water heaters anyway, and that’s a huge energy storage tank. It’s very cheap to add extra size and insulation and a controller that allows for automated control that can both improve the service and help to balance the power system. Many have developed models already. EV’s are an even easier load to shift.
HVAC systems have similar potential flexibility. The cost may not be as trivial as a water heater, but I expect it would be with a little innovation, innovation that I expect would happen very quickly if provided the right incentives. Those incentives will come very soon (I hope) with the recent FERC rule. There’s much more demand side flexibility here — about 18.5% of all power (we estimate). Half or more is commercial, with larger scale and more efficiency. LG now markets a solar system paired with an HVAC system to minimize back feeding. This isn’t optimal system management, but it just begins to show what’s possible.
Perhaps I was too oblique in that earlier quote, but I figured these demand-side technologies were common knowledge among readers of this blog.
The main challenges with nuclear is cost — it’s very expense, possibly on par with small-scale rooftop solar today, and the cost disadvantage will surely get worse. And it’s similarly inflexible (if not variable). Nuclear is even more expensive if you want it to be flexible, and smaller, which will be necessary. Maybe there’s a role for it, but in any truly optimized system, even one that completely ignores externalities and small but very extreme risks, I believe it will be a small one. (After Fukushima, many places won’t touch it, whether it’s rational or not.) The same goes for coal. The risk of obsolescence is huge. Look at investment under uncertainty (Dixit and Pindyck). If there’s a bit more innovation than we currently expect with solar, wind, batteries and demand response, all nuclear will be stranded assets in short order. It’s simply crazy for any shrewd investor to put more money after bad. At this point, baring some remarkable breakthrough innovation, I believe nuclear is a side show. Like coal, they simply cannot survive without subsidies and/or deeply inefficient policy.
In the real world, cost allocation for common costs is done using NARUC’s Electric Utility Cost Allocation Manual, written in 1992. I’m pretty sure that it’s woefully out of date given the development of competing electric generation technologies (solar panels and wind turbines) that were not feasible in 1992. Likewise, the presence of competitors in 1992 was not on the horizon nor was the concept of common carriage for electric transmission lines, which may be called on carry both power generated by a traditional electric utility and power from commercial competitors as well as distributed facilities owned and operated by residential consumers.
Any chance that this increase in capital investment is driven by catch-up investment in replacing very old distribution assets? A transformer can hang on a utility pole utterly maintenance-free for many decades before one-too-many people in the neighborhood install an EV charger, and all of a sudden, it’s time to invest again.
Another question I have is whether a quality difference between existing distribution equipment may justify the increased spending. The old gear is wires, transformers, fuses. The new gear has much more telemetry for monitoring and control. Perhaps some of that is unnecessary, perhaps it is the correct step to deal with the complexity of modern behind-the-meter generation and storage, controllable loads, etc.
Meredith and Duncan, great article. I appreciate all of the data you have compiled on trends in distribution spending. I just published an article on LinkedIn a few days ago about the challenges associated with using distributed resources to defer distribution investments and a pending CPUC decision to pilot a couple of new procurement mechanisms that are intended to improve the dismal results of the CPUC’s distribution deferral program to date. As I argue in the article, I don’t think the pilots will make much of a difference.
Here’s the link: https://www.linkedin.com/pulse/non-wires-alternatives-ever-yield-significant-savings-scott-murtishaw/
While I’m generally pessimistic about the use of distributed resources as non-wires alternatives (at least for distribution-level infrastructure), there are certain use cases where it makes more sense. In your article you mention workplace EV charging. In some cases, businesses that are planning to install a significant amount of EV charging are already incentivized to manage their impacts on the local grid because they are obligated to pay for upgrades to their services &/or dedicated transformers. These customers have can evaluate the relative costs of paying for those upgrades vs co-locating solar and, if it’s cost-effective, plan to install the solar at the same time as the EV charging equipment. However, in the cases where the distribution costs are socialized, timing is problematic. It doesn’t take long to install EV charging equipment in a parking lot. If upgrades are needed, there’s not much time to run a non-wires alternative solicitation and leave enough margin for the utility to execute the upgrades if the solicitation fails.
One way we might keep a lid on distribution costs is to plan our electrification thoughtfully. Here’s a link to a half hour video looking at electrifying homes without upsizing the main electrical panel. Basically picking high quality, low power appliance options and or circuit sharing devices.
If folks followed some of these techniques a lot of additional electrification could happen on our existing distribution infrastructure. This could raise the energy sales denominator and provide downward rate pressure.
An interesting and important post.
It is hard to know what kinds of distribution costs are really necessary for different kinds of power systems. The crux is getting incentives right: what can distributed resources, not just rooftop solar and batteries, but smart control systems and distributed thermal storage, do to minimize these costs?
I think it’s clear that utilities do not have an incentive to minimize these costs; quite the opposite — they find every excuse to maximize cost (Averch-Johnson). And the more complex the system, the easier it is to implement unnecessary investments. The high rate of return makes this worse, of course, and more costly to customers. But the poor institutional structure is the crux of the problem more than the direct cost of the high rate of return.
More pointedly: I suspect that if we could give utilities the same rate of profit for doing the right thing (being innovative in the way they employ distributed resources) instead of the wrong thing (finding any which way to cram capital into the distribution system), we’d all be a lot better off. I think economists need to work on this. Unfortunately, mechanism design and agency theory don’t seem to be the current fashion in the discipline, and few seem willing to challenge conventional utility-centric wisdom, for reasons I do not entirely grasp.
One bright spot is the new FERC rule that should allow distributed resources to be harnessed by third parities and sold into wholesale markets. This doesn’t resolve all issues with distribution investments, but it may help.
The main tool currently available to PUCs is to carefully audit investments, and simply render obsolete any that prove redundant or unnecessary after the fact, and disallow any further revenue collection. This would be big hit to their shareholders, and would critically change incentives going forward. I don’t think many PUCs have the audacity to do this, but even if one or two do it, it would set a powerful precedent. We need that. Soon.
I’d also wonder if your solar costs are a bit high. Tesla is offering $2/Watt for rooftop solar installed without batteries, and I’ve read some anecdotes about other large companies matching those prices, and occasionally beating them. What that translates to in cents/kWh will depend on the rooftop and the climate, as well as the discount rate (Lazard uses high rates). But using a home equity line rate (4% or less), I gather that for most parts of California $2/Watt is well under 10 cents/kWh. Times change fast in this industry. Of course, utility scale is under $1/Watt and they get more kWh per Watt installed than rooftop. Still, while I’ve been skeptical about the sensibility of rooftop solar in the past, when it gets this cheap, and surely cheaper in the coming years, things may well look different, depending on land and T&D costs.
I agree, the Lazard’s calculations use discount rates that are too high, which in turn, overstates the cost of energy produced by a capital-intensive resource.
In effect, Lazard’s uses a discount rate that reflects what a independent power producer would require on an after-tax basis to assume the risk of default by the energy off-taker. For a creditworthy counterparty, such as a utility, the default risk is de minimus so the Lazard’s may well be overstating the default risk. Also, Lazard’s is including the income taxes the IPP will pay on it profits. But we all know that from a societal perspective, income taxes are transfer payments – not true costs. Lastly, the Lazard’s discount rates are nominal rates that include inflation risk but the prices quoted for most IPP contracts are first-year prices that escalate over time.
The bottom line is that Lazard’s LCOE estimates are not good proxy’s for the societal costs of the resources they examine so they provide little guidance for use in developing public policy regarding which resources to promote.
Thanks for your work and interests in distribution costs.
It is important to note that distribution costs — along with most costs of centralized electric power production — are common costs. That is, they are common over a variety of market segments and customer classes. The allocation and recovery of those costs is generally done through complex cost-allocation models, that are, in the end, utterly arbitrary but touted as “scientific.” See Baumol’s article in PUF some years ago titled, “How Arbitrary is Arbitrary?”
The allocation of common costs can be anticompetitive. Consider a case where a disproportionate share of common costs are allocated for recovery from customers who deploy competing technologies, like solar panels that compete with centralized power generation.
I’d like to see some research into the anti-competitive potential of common cost allocation in the electric industry.
To a great extent, this is the Averch-Johnson effect at work.
Utilities are being allowed a rate of return that exceeds their incremental cost of capital. The typical US electric utility is allowed a 9% (higher in California) return on equity, in a market where incremental costs of equity capital are at record lows. Therefore they have a powerful economic incentive to make investments.
Couple that with a new focus on grid “resilience” and regulators are likely to accept these higher investments. Add to the mix the opportunities offered by smart grid improvements, such as being able to avoid generation investments by having direct load control and advanced pricing, and maybe, just maybe, this additional investment is cost-effective.
We see the result of allowed returns exceeding the cost of capital in the market-to-book ratio of electric utilities. If a utility is allowed to earn only a “fair return” on their “used and useful” capital stock, then their stock should sell for right around 100% of book value. That’s all it would be worth to investors.
Early in my career, during the high-inflation late 70’s and early 80’s, the cost of capital witnesses for utilities argued that the allowed return should be higher enough to support a market to book ratio of 1.04 to 1.08 — enough so that new equity issuance, after selling costs and market pressure effects, would yield the book value to the utility, avoiding dilution of existing shareholder assets when new shares are issued. But that’s not where utility share prices are today.
As of the date of this post, Feb. 8, 2021, market to book ratios according to Yahoo Finance, are much higher than 1.00. Edison International is at 159%, Sempra at 181%, Xcel at 241%, Duke is 157%, PNM is 219%, and even (bankrupt) PG&E at 113%.
The market is responding to this generosity — if regulators will give utilities more than a fair rate of return, then investors will bid up the market price, so that someone buying the stock today, at today’s market price, will receive ONLY a fair rate of return (and no more). So, you pay 150% of book value for something allowed 9% on book value, and you net 6% on your investment — about the market-required ROE for a stable investment.
Think about it for your own retirement account: would you be attracted to an investment with the stability of an electric utility, and an annual return of 9%?
Edison International is at 159%, Sempra at 181%, Xcel at 241%, Duke is 157%, PNM is 219%,
The Market-to-Book ratio of approximately 1.0 is only relevant for a regulated business. Edison International, Sempra, etc., are parent companies that own regulated business but also unregulated businesses engaged in power trading and IPP development. Unregulated businesses assume higher risks and are entitled to keep any supernormal profits they earn because they also will be stuck withy any losses they incur. For such entities MTB ratios are not particularly relevant.
Unless a regulated utility’s stock is publicly traded there is no straightforward way to calculate it’s MTB ratio. The market and book prices of a utility’s parent are not of much value.
Robert’s comment would be relevant under different circumstances.
Both Sempra and EIX derive about 90% of their revenues from utility operations. The parent companies are basically utilities. The small non-utility operations would not justify the market to book premium. That is justified by the CPUC granting them a nearly risk-free 10+% ROE (and FERC allowing an 11+% ROE) in a market that demands more like a 6% ROE for low-risk investments.
“Unregulated businesses assume higher risks and are entitled to keep any supernormal profits they earn because they also will be stuck with any losses they incur.”
Because earnings in one can offset losses in another, unregulated subsidiaries of energy holding companies assume no more risk than their regulated brethren. Most of PG&E Corporation’s 266 subsidiaries are LLCs, thus they qualify as Disregarded Entities that can freely transfer funds with their parent.
https://www.sec.gov/Archives/edgar/data/75488/000095010902001152/dex21.htm
PG&E Corporations’s electricity subsidiary, Pacific Gas and Electric Company, is a monopoly in its service area, and though technically it’s regulated by the California Public Utilities Commission, CPUC has no authority to look at the books of its fellow-subsidiaries. Self-dealing abounds – at the expense of PG&E ratepayers. For example, you can be sure that subsidiary “Pacific Energy Fuels Company”, which sells Pacific Gas and Electric Company its natural gas to generate electricity, charges a healthy markup – a cost which is passed through to ratepayers, with any profit passed through to PEFC’s parent.
I have no idea which subsidiaries build and maintain PG&E Corporation’s transmission assets, but as Jim points out the company has a powerful economic incentive to make investments – whether those investments benefit customers, or not. As a former chairman of the Assembly Utilities and Electricity Committee once told me: “In California, utilities are paid to build stuff.”
It is just like healthcare billing, distribution ‘costs’ are going up because more overhead is being packed in, and they can get away with it. Depreciation is taken during the life of an asset, but when time comes to replace-upgrade the PUC invariably approves rate increases. Cynical? Why not.