How opioid use spreads in families, worsening crisis

A bottle of opioids

Berkeley Haas researchers have identified another driver of the opioid epidemic in the United States: family ties.

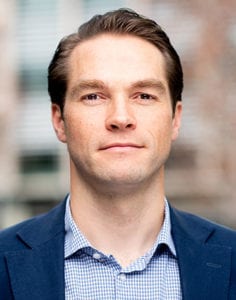
In a new study published in American Sociological Review, Asst. Prof. Mathijs de Vaan and Prof. Toby Stuart show that the likelihood of someone using opioids increases significantly once a family member living in the same household has a prescription. They also find that the chances of a relative obtaining a prescription for opioids within a year after a relative they live with gets one rises by 19 percent to over 100 percent, depending on family circumstances. Individuals from low-income households, for example, are the most likely to secure their own prescription after a family member does.

The study is one of the few analyses of the opioid crisis that finds a causal link between a specific action—in this case, the introduction of painkillers into a home—and their growing use. In all, de Vaan and Stuart analyzed hundreds of millions of medical claims and almost 14 million opioid prescriptions written between 2010 and 2015 and contained in a database operated by the state of Massachusetts. They were able to track family members’ health care through shared medical insurance policy numbers.

“Our research finds huge effects on the likelihood that family members who are influenced by other family members will start using opioids,” says de Vaan, a sociologist who studies social networks.

“Social contagion”

De Vaan and Stuart, who holds the Leo Helzel Chair in Entrepreneurship and Innovation at Haas, suggest two reasons for this contagion: when a family member takes painkillers, other relatives in the home observe firsthand its effects. Patients also typically receive more pills than they need, which means relatives may be tempted to experiment with leftovers sitting in the medicine cabinet.

Family members’ exposure to painkillers then increases the likelihood that they will visit a doctor within a year and obtain their own prescription. Other research has shown that Americans are more willing to ask for—and receive—specific treatments than consumers in other countries.

Because of this, de Vaan and Stuart offer a new insight into the role of physicians in the opioid epidemic. While it’s long been believed that physicians who work in the same community or are connected in other ways rely on each other for advice and adopt similar forms of treatment, the authors show that the explosion in opioid prescription rates may be coming from patients, too.

“The actions of one doctor toward one patient affect the requests that that patient then makes of other doctors he or she visits,” says de Vaan. “We find that physicians are not only influencing each other directly when it comes to opioid prescriptions. They’re influencing each other by steering patient demand.”

A causal link

Sociologists have long studied the role that social networks have on people’s health. Smoking and alcohol use are two prominent examples of habits families often share.

The problem with research into social contagion is that most of it identifies correlations, but can’t establish cause and effect. It’s possible that other factors—like genetics or the tendency for people to marry others like them—come into play, too.

De Vaan and Stuart, however, were able to establish a causal link between opioid prescriptions and an increase in the drug’s use within families. They did this by narrowing their research to emergency room visits only, where patients are randomly assigned to doctors who prescribe opioids at vastly different rates—so the likelihood that one patient received a painkiller prescription over another was random. The experiment also eliminated the possibility that family members who later got a prescription got one from the same doctor or that family members were visiting the same provider, such as a primary care physician.

 Finding prevention methods that work

De Vaan and Stuart suggest several steps to address the spread of opioid use within families. To prevent so-called “doc shopping,” states that track prescription drug use and make that information available to doctors could also include data on family members’ access to medications. To avoid violating the privacy of relatives, de Vaan says the program could simply issue a “risk” score that would signal to doctors that their patient has been indirectly exposed to painkillers at home.

Policymakers could also expand upon existing efforts to collect leftover prescription drugs—namely through National Prescription Drug Take Back Day—by paying people to return their excess supply. The upfront costs would likely be offset by the money saved in addiction treatment and other costs, de Vaan says. Doctors should also be trained on how to push back when patients ask for painkillers.

“We’ve identified a specific driver of opioid consumption, so all of these steps make a lot of sense,” de Vaan says.

How the stock market is fueling the wealth gap: Q&A with Prof. Martin Lettau

The stock market’s recent rise reflects a dramatic shift in wealth from workers to investors, according to new research by Prof. Martin Lettau

How the stock market fuels wealth inequality

In decades past, a rising stock market was a reflection of economic growth. But no longer.

New research by finance Prof. Martin Lettau has found that economic growth accounted for less than a quarter of the stock market’s rise over the past 30 years—compared with 92% of the increase in the prior three decades.

The biggest driver of the recent bull market? A dramatic shift in wealth from workers to investors, accounting for 54% of the market’s increase since 1989.

Martin Lettau
Prof. Martin Lettau (Photo: Noah Berger)

That’s the conclusion of Lettau’s new paper, “How the Wealth Was Won,” co-written with Daniel Greenwald of MIT and Sydney Ludvigson of New York University. They show that most of the stock market gains of the past three decades have come from shareholders getting a bigger and bigger piece of the economic pie.

Lettau’s research points to a potentially critical driver of the growing wealth inequality plaguing the U.S.: At a time of slowing economic growth, those at the top of the wealth distribution are reaping most of the rewards, while the share of income received by the rest of households has declined.

The research explores hot-button issues that are not the standard fare for financial economists. We spoke with Lettau, an expert in investments and financial markets who holds the Kruttschnitt Family Chair in Financial Institutions, about how the stock market has seized the lion’s share of 30 years of economic growth, and whether this trend is sustainable.

You write about a widening chasm between the stock market and the broader economy. What specifically are you referring to?

U.S. stock values have grown faster than the economy over the past 29 years. After adjusting for inflation, the stock market value of corporations outside the financial sector has risen an average of 8.4 percent a year since 1989. At the same time, the value of the economic output of corporations has climbed just 2.5 percent annually. By contrast, from 1959 to 1988, economic output was expanding faster than stock values.

What did you find was behind this trend?

We considered the entire economic pie that was produced and the different actors in the economy. We found that, over the long run, the movement in stock values stemmed largely from shifts in wealth from labor to capital. Put plainly, the long-standing bull market of past 30 years comes largely from the capital sector getting more of the economic pie than the labor sector.

How big a factor has this shift been in pushing stock prices higher, compared with other factors?

We looked at the factors that standard financial theory considers to be drivers of stock prices, including fluctuations in short-term interest rates, changes in investor tolerance of risk, and economic growth. We did a statistical analysis to measure how much each of these factors contribute to stock market valuations. We found falling interest rates and greater investor appetite for risk have each contributed 11%. Economic growth explains just 23% of the stock price increase. Meanwhile, we estimate that the reallocation of the rewards of production to shareholders and away from labor has accounted for a full 54% of the gains in stock market value since 1989. That’s a sharp turnaround from 1952 to 1988, when other factors accounted for just 8% of the rise in stock prices, while economic growth accounted for 92% of the increase.

Why has capital’s share of the pie grown and labor’s share shrunk?

Our work doesn’t directly address the underlying reasons why we’ve had these shifts. But there’s some work by labor economists that has come up with plausible explanations. One is the decline in union power, which has weakened labor’s voice in setting wages. Another is outsourcing, which moved work to cheaper domestic or international sources of labor, putting pressure on pay. Third is technology, which is replacing manual labor with intensive productive capital. Thirty years ago robotics barely existed. Now it’s everywhere. Well-educated workers reap the benefits, but those without the skills in demand today are left behind.

Inequality of income and wealth have become pressing concerns in recent years. What does your work tell us about the sources of inequality?

This is a very important question, not just in the United States, but in much of the developed world. What our work suggests is that part of increased inequality could be due to the stock market. The overall economic pie is growing, but not at very high rates. The segment of the population that owns stocks has reaped the benefits of this growth relative to those who don’t own stocks. And, while it’s true that more people hold stock today than in the past thanks to retirement investments like 401(k)s, stock ownership is still highly concentrated.

It’s striking that this shift has happened during a period of slowing economic growth—just 2.5% annually versus 4.5% in the prior period, you found. Meanwhile, the Congressional Budget Office (CBO) projects that real GDP over the next decade will grow just 1.7% annually. Is this trend sustainable?

Without fully understanding the economic forces that caused these trends in the postwar data, it is difficult to assess how they will evolve in the future.  For example, technological changes are unlikely to be reversed, but other factors could be reversible. If the Congressional Budget Office’s projections for GDP turn out to be correct, and the growth of the total economic pie is sluggish, stock market investors will not see growth rates as in the recent past unless the labor share declines further. Since the end of the great recession, income growth has been robust and kept pace with corporate profits, but it is not clear whether this signals a short-term phenomenon or a change in long-term trends.

You’re bringing together two disciplines that are usually kept separate: financial economics and labor economics. What’s the significance of this?

Our contribution is to connect broad economic trends with the financial markets. We examined the overall economy because we have plenty of data. It would be useful to know on a more granular level who has benefited from the economic shifts we describe. But to do a deeper dive into household wealth is difficult because data is limited. There’s very little information on what kinds of households hold what kinds of assets.

How information is like snacks, money, and drugs—to your brain

Group of young people using smartphone mobile phone_Ming Hsu research

Can’t stop checking your phone, even when you’re not expecting any important messages? Blame your brain.

A new study by researchers at UC Berkeley’s Haas School of Business has found that information acts on the brain’s dopamine-producing reward system in the same way as money or food.

“To the brain, information is its own reward, above and beyond whether it’s useful,” says Assoc. Prof. Ming Hsu, a neuroeconomist whose research employs functional magnetic imaging (fMRI), psychological theory, economic modeling, and machine learning. “And just as our brains like empty calories from junk food, they can overvalue information that makes us feel good but may not be useful—what some may call idle curiosity.”

Assoc. Prof. Ming Hsu of the Haas Marketing Group

The paper, “Common neural code for reward and information value,” was published this month by the Proceedings of the National Academy of Sciences. Authored by Hsu and graduate student Kenji Kobayashi, now a post-doctoral researcher at the University of Pennsylvania, it demonstrates that the brain converts information into the same common scale as it does for money. It also lays the groundwork for unraveling the neuroscience behind how we consume information—and perhaps even digital addiction.

“We were able to demonstrate for the first time the existence of a common neural code for information and money, which opens the door to a number of exciting questions about how people consume, and sometimes over-consume, information,” Hsu says.

Rooted in the study of curiosity

The paper is rooted in the study of curiosity and what it looks like inside the brain. While economists have tended to view curiosity as a means to an end, valuable when it can help us get information to gain an edge in making decisions, psychologists have long seen curiosity as an innate motivation that can spur actions by itself. For example, sports fans might check the odds on a game even if they have no intention of ever betting.

Sometimes, we want to know something, just to know.

“Our study tried to answer two questions. First, can we reconcile the economic and psychological views of curiosity, or why do people seek information? Second, what does curiosity look like inside the brain?” Hsu says.

The neuroscience of curiosity

To understand more about the neuroscience of curiosity, the researchers scanned the brains of people while they played a gambling game. Each participant was presented with a series of lotteries and needed to decide how much they were willing to pay to find out more about the odds of winning. In some lotteries, the information was valuable—for example, when what seemed like a longshot was revealed to be a sure thing. In other cases, the information wasn’t worth much, such as when little was at stake.

For the most part, the study subjects made rational choices based on the economic value of the information (how much money it could help them win). But that didn’t explain all their choices: People tended to over-value information in general, and particularly in higher-valued lotteries. It appeared that the higher stakes increased people’s curiosity in the information, even when the information had no effect on their decisions whether to play.

The researchers determined that this behavior could only be explained by a model that captured both economic and psychological motives for seeking information. People acquired information based not only on its actual benefit, but also on the anticipation of its benefit, whether or not it had use.

Hsu says that’s akin to wanting to know whether we received a great job offer, even if we have no intention of taking it. “Anticipation serves to amplify how good or bad something seems, and the anticipation of a more pleasurable reward makes the information appear even more valuable,” he says.

Common neural code for information and money

How does the brain respond to information? Analyzing the fMRI scans, the researchers found that the information about the games’ odds activated the regions of the brain specifically known to be involved in valuation (the striatum and ventromedial prefrontal cortex or VMPFC), which are the same dopamine-producing reward areas activated by food, money, and many drugs. This was the case whether the information was useful, and changed the person’s original decision, or not.

Next, the researchers were able to determine that the brain uses the same neural code for information about the lottery odds as it does for money by using a machine learning technique (called support vector regression). That allowed them to look at the neural code for how the brain responds to varying amounts of money, and then ask if the same code can be used to predict how much a person will pay for information. It can.

In other words, just as we can convert such disparate things as a painting, a steak dinner, and a vacation into a dollar value, the brain converts curiosity about information into the same common code it uses for concrete rewards like money, Hsu says.

“We can look into the brain and tell how much someone wants a piece of information, and then translate that brain activity into monetary amounts,” he says.

Raising questions about digital addiction

While the research does not directly address overconsumption of digital information, the fact that information engages the brain’s reward system is a necessary condition for the addiction cycle, he says. And it explains why we find those alerts saying we’ve been tagged in a photo so irresistible.

“The way our brains respond to the anticipation of a pleasurable reward is an important reason why people are susceptible to clickbait,” he says. “Just like junk food, this might be a situation where previously adaptive mechanisms get exploited now that we have unprecedented access to novel curiosities.”


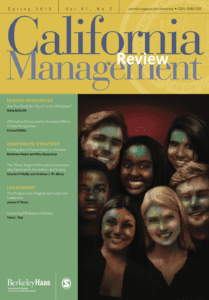
California Management Review features Berkeley Haas research on Gen Z, affirmative action

The spring issue of California Management Review features two new articles by Berkeley Haas faculty.

Senior Lecturer Holly Schroth was motivated by her recent experiences in the classroom to research and write “Are you ready for Gen Z in the workplace?”. As a long-time lecturer at Berkeley Haas, Schroth admits that she wasn’t connecting quite as much with this generation as she had with previous students. “It made me wonder about this group and what they respond to,” she said.

Members of Generation Z, defined as those born between the years of 1997 and 2013, are just beginning to enter the labor market. Like millennials, they are very tech savvy and have spent most of their childhood surrounded by screens, limiting the time they spend in face-to-face interactions. Gen Z also lacks work experience–only 34% of teens had a job in 2015 compared to 60% in 1979. Employers have already observed that recent hires are having trouble adjusting to the social aspects of work in the corporate world.  “Social interaction in the workplace is a language,” Schroth noted. “Thankfully, it can be taught.”

Ultimately, Schroth advises managers to help Gen Z employees foster a sense of autonomy by providing training and then allowing them to take ownership of projects.


Also included in the issue is “Affirmative Action and its Persistent Effects: A New Perspective,” by Berkeley Haas Asst. Prof. Conrad Miller.

Miller, a labor economist in the Haas Economic Analysis & Policy Group, examines how companies responded to temporary federal affirmative action regulation. While under regulation, affirmative action increased a company’s black share of employees. But Miller discovered that the black share of employees continued to grow at a similar pace even after a firm is deregulated. This signals that companies made fundamental shifts in their hiring practices, driven in part by affirmative action rules that induced them to improve their methods for screening potential hires.

This piece builds upon Miller’s recent paper, “The Persistent Effect of Temporary Affirmative Action,” published in American Economics Journal: Applied Economics. Federal affirmative action policies, though controversial, have been demonstrated to substantially improve diversity and representation in schools and the workplace. This research provides further evidence. “If a firm is doing something without a regulation in place, presumably their behavior is consistent with their goals,” Miller said.


Published quarterly by Berkeley Haas, California Management Review is a top-ranked management journal that serves as a bridge of communication between those who study management and those who practice it.

Read the spring edition of California Management Review.

How hedge funds use satellite images to beat Wall Street—and Main Street

Berkeley Haas research finds there may be a dark side to the rise of “alternative data” in capital markets

Illustration of a satellite orbiting the earth

While Assoc. Prof. Panos Patatoukas was discussing Walmart in his Financial Information Analysis course last year, a student brought up the story of how company founder Sam Walton used to count cars in store parking lots to gauge how sales were going.

Patatoukas knew that sophisticated investors had begun doing exactly that on a large-scale basis by analyzing satellite images of retailers’ parking lots, and he began to wonder just how much of an edge it was giving them. So he called up the company that pioneered satellite-image car counting and pitched the CEO on the idea of letting an academic analyze the data. With the help of funding from the Fisher Center for Business Analytics, he landed 4.8 million images of parking lots at 67,000 individual stores across the U.S. owned by 44 major retailers, including Walmart.

Berkeley Haas Assoc. Prof. Panos N. Patatoukas
Berkeley Haas Assoc. Prof. Panos Patatoukas

The resulting analysis by Patatoukas and Assoc. Prof. Zsolt Katona—the first to quantify in detail the advantages of trading based on satellite imagery of parking lot traffic—found that the strategy can indeed deliver a significant boost for investors savvy enough to exploit it. Traders can accurately anticipate earnings news based on parking lot volume and earn significantly more than a typical benchmark return.

“The informational advantage yields 4% to 5% in the three days around quarterly earnings announcements, which is a significant return over such short window,” Patatoukas says. “If you annualize it, the number is staggering.”

The researchers also found that although this type of satellite data has been commercially available since 2011, the information hasn’t spread beyond a select few large investors, mostly hedge funds. That’s led to a consistently profitable strategy for hedge funds at the expense of individual investors, Patatoukas says: In particular, investors with access to satellite imagery data can get ahead of the rest of the market and target retailers with bad news for the quarter. This investment edge allows them to bet against those retailers by short selling their stock, even as individual investors are still buying.

“What we found is that it’s a gain for large sophisticated investors who can afford the substantial costs of acquiring and processing big alternative data at the expense of Main Street investors,” Patatoukas said. “If it was just a transfer of wealth between hedge funds, that would be a different story, but it’s small individual investors who tend to be on the other side of the trade.”

His working paper—co-authored by Marcus Painter at the University of Kentucky and Berkeley Haas doctoral student Jieyin Zeng—raises questions about individual investor protections in an age of new “alternative data” sources. Even as technology has made trading more accessible to the masses, the rise of big data is creating so-called alternative data that only those with superior resources are tapping into.

The “dark side” of big data

Skilled investors have always competed for an information edge that allows them to outperform the market by even fractions of a percentage point—that’s how Wall Street operates. Until recently, however, those traders had access to the same reports, earnings calls, SEC filings, and other public sources of information as everyone else. Trading on material non-public information, after all, is against the law, and the SEC makes detection and prosecution of insider trading one of its top enforcement priorities.

But technology is increasingly blurring the boundaries between public and private information, creating data opportunities that are legal, but are expensive and often require special expertise to access.

“Technology was supposed to level the playing field, but what I see is the fence separating sophisticated and unsophisticated investors growing higher,” says Patatoukas, who is passionate about teaching his students to analyze public sources of financial information and finds the trend troubling. “That’s the dark side of big data. Our evidence suggests that unequal access to alternative data leaves individual investors outside the information loop.”

How to formulate a trading strategy from outer space

RS Metrics pioneered the analysis of satellite images of parking lots in 2011, with hedge funds as their primary customers. Other companies such as Orbital Insight have followed suit, obtaining images from satellite companies and processing them with both software and human analysts. Not only is the data expensive, but it takes substantial skill to analyze and combine with other information sources to yield results, Patatoukas says. “You have to have the right people, and those people tend to be expensive.”

Patatoukas’ paper lays out exactly how investors can formulate a trading strategy from outer space. Using images from RS metrics from 2011 to 2017 covering 44 major U.S. retailers, including Walmart, Target, Costco, and Whole Foods, the researchers confirmed that year-over-year changes in the number of cars in individual stores’ parking lots is a reliable predictor of quarterly sales—a widely used metric for retailers’ performance. The researchers later added in more images from competing firm Orbital Insight, which covers the same companies, and found that combining the two datasets allowed for even more accurate predictions, and an even more profitable strategy.

In fact, parking lot volume is such a reliable indicator of retail sales that it can be used to identify errors in analysts’ forecasts in the three-week period after stores’ quarterly earnings are in, but before they’re announced to the public. Using data from Markit, a service that tracks daily institutional lending activity, they found a boost in stock lending in the five days before earnings announcements. That’s an indication of “informed short selling activity,” targeting retailers with bad news for the quarter (the strategy works with long and short-sale positions, but the researchers found it is most profitable for short sales).

Meanwhile, drilling into data on trading by individual investors during the same period, they found that individuals are net buyers of the same retailers that the hedge funds are betting against. Main Street investors can’t piggyback on what the hedge funds are doing since the short-selling market is opaque: The general investment community can only see short-interest data twice per month, and only with a significant delay.

In terms of market reaction to earnings announcements, they found no difference between retailers covered by the satellite image companies and those that are not. Clearly, the parking lot intelligence is not increasing price discovery for the market overall, Patatoukas says.

“Over the last seven years it’s been a pretty profitable strategy for hedge funds, and the value of the parking lot signals hasn’t yet been competed away. Part of that has to do with the fact that access to satellite imagery data has been so exclusive,” he says. “Once uncertainty about the signals has been removed and it’s known that there’s value to be extracted, more investors will start using it and the advantage will be competed away.”

In that regard, Patatoukas says, the dissemination of the working paper itself will impact the market for satellite parking lot data in the short term, since it provides the first independent analysis showing whether—and how—trading from outer space works.

Regulatory interest

In the aftermath of the financial crisis, there has been increased regulatory interest in the role of informed trading and disclosure requirements to protect the fairness and integrity of capital markets. With this in mind, Patatoukas hopes that the paper will get the attention of the regulators. “In a market setting where the line separating public from material non-public information is getting blurrier, the question that regulators need to answer is: What is their role in terms of leveling the playing field for individual investors?”

While the value of the parking lot data will dissipate as technology improves and it becomes more accessible, investors will no doubt find new data sources that will yield insights once only available to company insiders. For example, investors may already be harvesting geolocation data from inside consumers’ pockets as they move around stores with their smartphones, Patatoukas says.

“This is just the tip of the iceberg,” Patatoukas says. “While so far the focus has been mostly on the bright side of big and alternative data, there might be a less auspicious side to the rise of such data in capital markets.”

Visiting professor gives fine wine market a data-driven shakeup

A bartender looks at bottles in a wine cellar

For hundreds of years, a tiny group of négociants or wine brokers have determined the price that distributors, importers, and eventually consumers will pay for France’s top wines. These prices are based on the barrel scores of elite tasters, along with the brokers’ own expertise—and a generous splash of guesswork about the market.

That tradition-bound system is getting a data-driven shakeup this month with the debut of a new pricing algorithm on London’s Liv-ex fine wine market.

Visiting Prof. Burak Kazaz

The algorithm was developed by Burak Kazaz, a Berkeley Haas visiting professor (and the Steven R. Becker professor at Syracuse University’s Whitman School of Management), and Hakan Hekimoğlu of Rensselaer Polytechnic Institute. They established “realistic prices” for the 2018 en primeur (or wine futures) campaign—wines from last year’s vintage that are aging in the barrel and will hit shops and restaurants next year.

“This is the most important progression in making a transparent market for wine futures since the négociant system was established more than 300 years ago,” says Kazaz, who pioneered the field of wine analytics. “The realistic pricing will tell buyers and consumers whether a wine is underpriced or overpriced, leading to more effective and transparent purchase decisions. It will also tell winemakers how they can determine their own selling price to négociants.”

The algorithm incorporates temperatures, precipitation, market conditions based on the Liv-ex 100 index of top wines, and price trends based on barrel scores for wines from Bordeaux’s leading chateaus determined by tasting experts Lisa Perrotti-Brown (of The Wine Advocate) and James Suckling (formerly of The Wine Spectator). These influential tasters sample young wines a year after they are barreled, and one year before they are released to the market, scoring them on a 100-point scale.

The “realistic pricing” algorithm allows distributors and consumers to translate a Bordeaux’s score into a dollar amount, getting a clear idea of whether they’re getting a good deal or overpaying. For the 2018 vintage, the algorithm predicts a 3% price increase per additional point compared with the 2017 vintage.

The algorithmic pricing system is expected to shake up the wine futures market, but also to make it less risky, since investors will have a data-driven price for the first time and winemakers will know what price to set for their young wines. Kazaz and Hekimoğlu’s study was recently featured in Robert Parker’s influential Wine Advocate.

While the wine futures market doesn’t exist in the U.S., where individual wineries tend to set their prices, Kazaz is exploring the idea of bringing data driven-pricing to the U.S. market.

Kazaz teaches operations and supply chain management in the Berkeley Haas MBA program.

New research shows how companies game the system to boost CEO pay

Excessive CEO pay_Mathijs De Vaan

A rule designed to make executive compensation more transparent has instead given companies a tool to push CEO pay even higher, according to an analysis by researchers at UC Berkeley’s Haas School of Business and Columbia University.

Since 2006, the Securities and Exchange Commission has required public companies to name a group of peer companies that they use to benchmark their chief executives’ salaries, giving investors and the public a reference point to judge whether CEO paychecks are within reason. But while benchmarking is a good idea in theory—applauded by corporate governance experts—in practice companies tend to cherry-pick peers with highly paid CEOs, says Berkeley Haas Asst. Prof. Mathijs De Vaan.

“We found strong evidence that the benchmarking process has been systematically gamed,” says De Vaan, an economist in the Haas Management of Organizations Group. “Peer groups are assembled more to legitimize excessive pay than to provide objective information about an appropriate level of compensation.”

Not only that, but companies are even more likely to skew their peer group when their CEO underperforms, De Vaan concluded in a new paper published in the journal Management Science and coauthored by sociologists Benjamin Elbers and Thomas A. DiPrete of Columbia University.

Dramatic rise in CEO pay

Mathijs De Vaan_Copyright Noah Berger / 2019
Mathijs De Vaan

The dramatic rise in executive pay in recent years is fueling the growing income inequality that has become a first-order public policy issue, economists have found. Average CEO compensation jumped 12% per year from 1980 to 2004, swelling from $625,000 to $9,840,000. And while the median market capitalization for companies in the S&P 1500 grew just 22% from 2007 to 2014, median CEO compensation grew 39%, according to the paper. To allow for more public scrutiny of CEO pay, the SEC began requiring companies to disclose what peer companies pay their chief executives.

Skewed peer groups

Since then, a number of researchers have looked into whether this executive compensation benchmarking process is fair and unbiased, but measuring it has proved tricky. De Vaan and his coauthors came up with a novel way of determining whether compensation benchmarks were skewed toward higher salaries. Using data from more than 3,400 companies that reported compensation peer groups to the SEC between 2006 through 2016, they developed a model to generate alternative benchmark​ groups that were free from bias. They did this by creating reciprocal groups of peers—that is, if company A compared its CEO’s pay with that of company B, company B would also ​benchmark against company A. They used the model to simulate hundreds of alternative peer groups, and then compared these with the benchmark​ groups​ companies actually used.

The results strongly suggest that companies typically chose a skewed sample of highly paid CEOs. Not only that, but these skewed peer groups were closely associated with real increases in CEO compensation. In other words, benchmarking was used to justify high pay, and CEOs benchmarked against highly paid peers were paid substantially more, they concluded.

Underperformers get bigger rewards

In fact, the researchers found that benchmarking is even more skewed when CEOs fail to meet their performance targets, such as stock market value and profit. De Vaan and his coauthors found new evidence that these underperforming CEOs get especially generous pay packages. The researchers’ statistical analysis showed that decreases in returns on assets—a standard profitability measure—were associated with wider gaps between the selected peer group and the simulated peer groups created by the researchers.

“If you’re a CEO who doesn’t perform well, your compensation should be adjusted downward,” De Vaan says. “One way companies prevent that is by introducing more bias.”

The authors also found that companies that had greater discretion in choosing peer firms, perhaps because they didn’t fit neatly into an industry category, tended to use that flexibility to select peer groups with even higher-paid executives.

Finally, De Vaan and his coauthors looked at how peer-group benchmarking has changed over time. They found that the average level of bias has diminished, which may reflect growing shareholder and regulatory pressure on companies to avoid abusing the disclosure process. However, the association between peer group bias and executive pay has increased over time, meaning that CEOs get greater financial gains from skewed benchmarking now than they did in the past.

A role for watchdogs

Why don’t boards push back? The researchers point out that board members may want to maintain cordial relationships with their CEOs, and also that they tend to be executives themselves, and may be inherently biased toward increasing executive pay.

Although the authors did not explore the indirect effects of peer-group benchmarking, De Vaan thinks it’s probable that biased benchmarking by some companies may also affect firms that aim to select an unbiased set of peers. When a company skews its peer group to push up its own CEO’s pay, that in turn becomes a potential reference for other companies. “Given the network nature of this process, it is difficult to be honest,” he says.

Is there a way to stop the merry-go-round? De Vaan thinks probably not, as long as companies select their own peer groups for benchmarking. But the story would be different if industry watchdogs or regulators created unbiased peer groups for companies that were similar in size and business mix. That would allow benchmarking to do what it is supposed to do—give shareholders an objective way of evaluating whether CEOs deserve their pay.

Classified: Training PhD students to advance the open science revolution

Note: The “Classified” series spotlights some of the powerful lessons faculty are teaching in Haas classrooms.

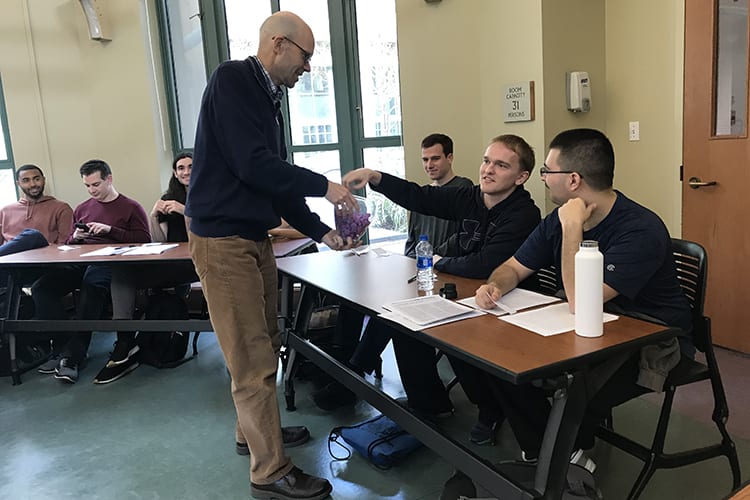
Prof. Don Moore passes around a jar filled with the titles of research papers on the psychology of scarcity. Psychology PhD student Ryan Lundell-Creagh selects the paper that he’ll have to replicate.

As a young researcher, Kristin Donnelly was captivated by the work of social psychologists who published striking insights on human behavior, such as a finding that people walked more slowly after being exposed to the words gray, Florida, and Bingo. That was one of many surprising studies that had crossed into mainstream pop culture—thanks to books like Malcom Gladwell’s Blink—but there was a problem: No one could reproduce them.

“It was a sad, dark time to enter the field,” says Donnelly, who is now a Berkeley Haas PhD student in behavioral marketing. “I was pursuing similar ideas to people who had these incredible studies, but I couldn’t get any significant results. I became very disillusioned with myself as a researcher.”

Psychology has been rocked by a full-blown replication crisis over the past few years, set off in part by a 2011 paper co-written by Haas Prof. Leif Nelson. It revealed how the publish-or-perish culture—which rewards novel findings and did not reward attempts to replicate others’ work—led researchers to exploit gray areas of data analysis procedures to make their findings appear more significant.

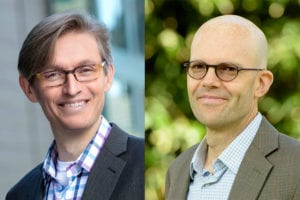
Professors Leif Nelson and Don Moore are leaders in the open science movement.

Now Nelson, along with Prof. Don Moore, is working to train a new generation of up-and-comers in methodologies that many see as key to a rebirth of the field. This semester, they’re leading Donnelly and 22 other doctoral students from various branches of psychology in what may be a first for a PhD seminar: a mass replication of studies around one psychological theory: to see how well they hold up.

“We aren’t doing this because we want to take down the literature or attack the original authors. We want to understand the truth,” says Prof. Don Moore, an expert on judgement and decision-making who holds the Lorraine Tyson Mitchell Chair in Leadership and Communication. “There are many forces at work in the scientific publication process that don’t necessarily ensure that what gets published is also true. And for scientists, truth is at the top of the things we ought to care about.”

Examining the psychology of scarcity

The theory they’re examining is the “psychology of scarcity,” or the idea that being poor or having fewer resources actually impairs thinking. Moore and Nelson chose it not because of an inherent flaw, but because it’s relatively new (defined by a 2012 paper), high profile, and relevant to the students’ interests. Each student was randomly assigned a published study, and, after reaching out to the original researchers for background details, is attempting to replicate it. Results will be combined in a group paper.

“At Berkeley, we’re at the epicenter of this new methodological and statistical scrutiny, and as a young researcher I want to do good work that will replicate,” says Stephen Baum, also a PhD student in behavioral marketing at Haas. “Most people were willing to take things at face value before 2011. Things have changed, and we all have to do better.”

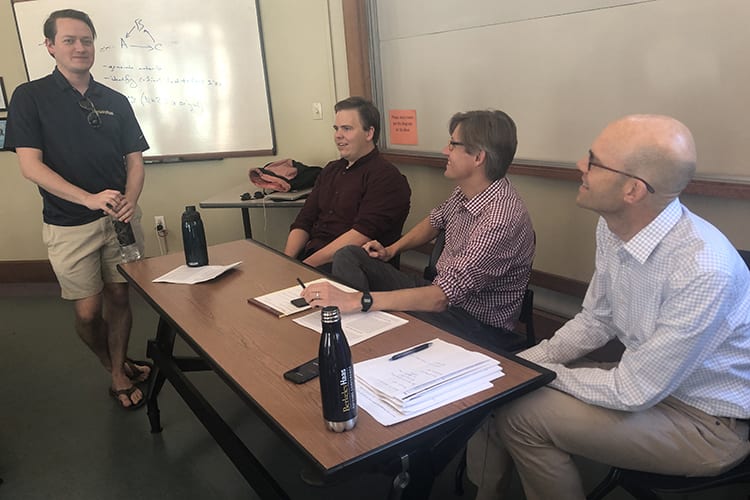
Berkeley Haas PhD student Derek Schatz chats with Graduate Student Instructor Michael O’Donnell and professors Leif Nelson and Don Moore during a class break.

Moore and Nelson are leaders in the growing open science movement, which advocates for protocols to make research more transparent. Nelson, along with Joseph Simmons and Uri Simonsohn of Wharton, coined the term “P-hacking” in 2011 to describe widespread practices that had been within researchers’ discretion: removing data outliers, selectively reporting data while “file drawering” other results, or stopping data collection when a threshold was reached. These practices, they argued, made it all too tempting to manipulate data in pursuit of a P-value less than 0.05. That translates to a less than 5% chance that the results were due to pure chance, and it’s the standard for demonstrating statistical significance and the threshold for getting published.

Building confidence through pre-registration

At a recent session of their PhD seminar, Moore and Nelson led a discussion of one of the key ways to combat P-hacking: pre-registering research studies. It sounds arcane, but it’s simply the grown-up equivalent of what grade-school teachers require students to do before starting on their science fair project: Write out a detailed plan, including the questions to be answered, hypothesis, and study design, with key variables to be observed.

“How many of you are working with faculty who pre-register all their studies?” asks Nelson, a consumer psychologist in the Haas Marketing Group and the Ewald T. Grether Professor in Business Administration and Marketing. Less than half the class raises their hands.

Nelson and Moore estimate that only about 20% of psychology studies are now pre-registered, but they believe it will soon become a baseline requirement for getting published—as it has become in medical research. Although there’s no real enforcement body, the largest pre-registration portal, run by Brian Nosek of the Center for Open Science, creates permanent timestamps on all submissions so they can’t be changed later. Nelson co-founded his own site, AsPredicted, which now gets about 40 pre-registration submissions per day. It’s patrolled by a fraud-detecting robot named Larry that dings researchers for potential cheats like submitting multiple variations of the same study.

“Without pre-registration, statistics are usually, if not always, misleading,” Moore tells students. “They aren’t entirely worthless, but they’re worth less.”

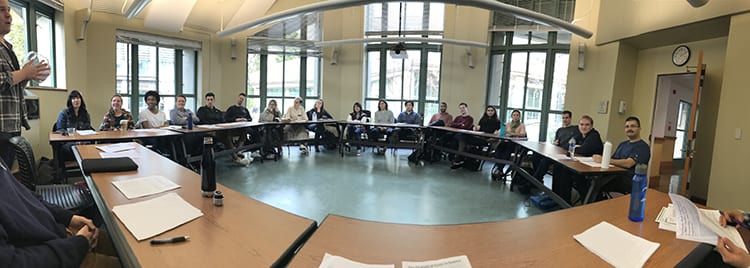
The class is the largest PhD seminar that Moore has ever taught.

Gold Okafor, a first-year PhD student studying social and personality psychology, says she plans to pre-register all her future studies. Though it requires a bit more work up front, it may save time in the end. “I think if you don’t use some of these methods, you could be called out and have your work questioned,” she says.

Students are also learning techniques such as P-curving, which is a way to determine the strength of a study’s results and whether data manipulation may have occurred. They’re also learning from guest lectures from other open science leaders, including Economics Prof. Ted Miguel and UC Davis Psychology Prof. Simine Vazire, who edits several journals.

The bedrock of the scientific method

Then there’s reproducibility, one of the bedrocks of the scientific method and the heart of the course. The American Psychological Association now promotes systematic replications, where multiple researchers around the world all re-create the same study. (PhD student Michael O’Donnell, who is assisting Nelson and Moore in teaching the course, recently led one such effort that cast doubt on a study finding that people who were asked to imagine themselves as a “professor” scored higher on a trivia quiz than those who imagined themselves as a “soccer hooligan.”)

Baum, the marketing student, will be replicating a psychology of scarcity study that was published in the flagship journal Psychological Science. The researchers asked people to recall a time when they felt uncertain about their economic prospects, and then write about how much pain they were experiencing in their body at that moment. The finding was that those people reported feeling more pain than those in a control group prompted to recall a time when they felt certain about their economic prospects.

“If it replicates, I will be surprised, but I’ve been wrong before,” Baum says.

No matter what the results, the replications will offer important new insights into the psychology of scarcity—important to understand in a society plagued by growing inequality, Moore says. Beyond the one theory, the fact that the course has the highest enrollment of any PhD seminar he’s ever taught gives Moore great hope for the future.

“The stakes are high,” he says. “The most courageous leaders in the open science revolution have been young people—it’s the doctoral students and junior faculty members who have led the way. The next generation will be holding themselves, and each other, to higher standards.”

Donnelly is a case in point. “This whole movement has made me a better researcher. I’ve changed what questions I ask, I changed how I ask them, and I changed how I work,” she says. “It’s a brave new world, and we may be able to lay the foundation of a new science that will build on itself.”

Embracing diverse values in company culture pays off—literally

Berkeley Haas Assoc. Prof. Sameer Srivastava found organizations that embrace diversity are more innovative

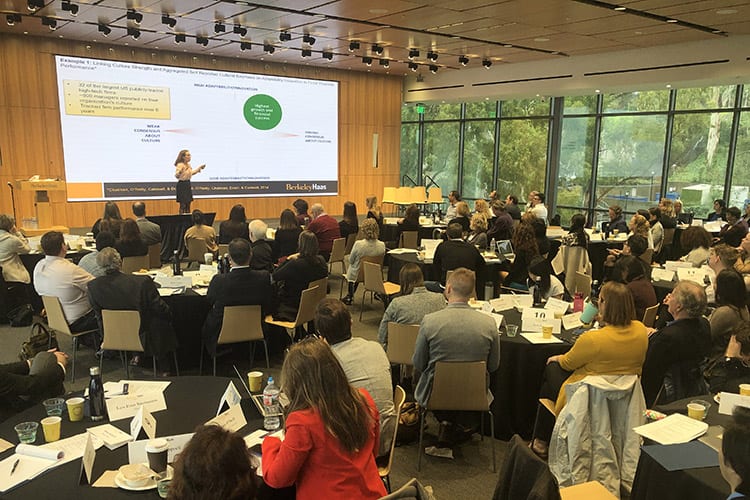
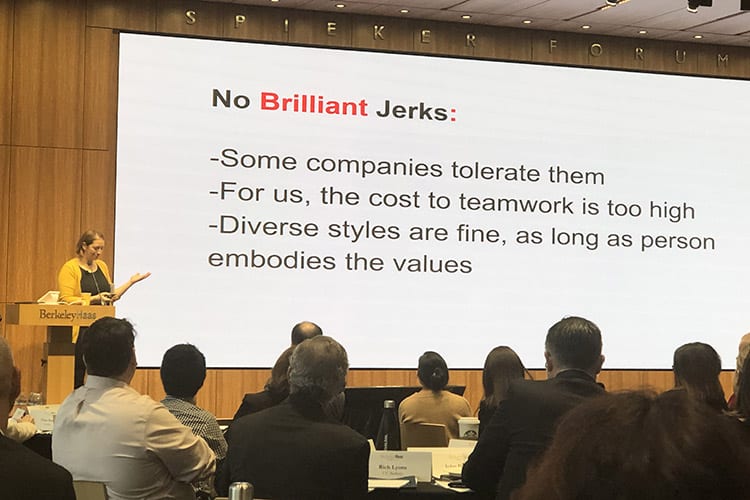
Zappos says its 10 core values are a “way of life,” while Netflix details seven aspects of its culture, nine “highly valued behaviors and skills,” plus deal-breakers like “no brilliant jerks.” Nordstrom has just one rule of thumb: “Use good judgment in all situations.”

More and more companies are asking employees to adopt a set of core values, seeking to build a culture that will give them an edge. But while getting everyone on the same page makes it easier for people to work together, too much of the same thinking can stifle creativity. What’s the right balance of cultural values to drive profitability, growth, and innovation?

An analysis of 500,000 Glassdoor.com reviews of S&P 500 firms found that companies whose employees disagree on core values are, indeed, less profitable than similar companies where workers are culturally aligned. Meanwhile, the firms that are the most highly valued and innovative have something in common: They embrace a diverse range of cultural values throughout the organization.

Sameer Srivastava
Assoc. Prof. Sameer Srivastava co-directs the Computational Culture Lab and the Berkeley Culture Initiative.

“Past research has suggested there’s a tradeoff between diversity and productivity,” said Berkeley Haas Assoc. Prof. Sameer Srivastava, co-author of the study, which is forthcoming in Administrative Science Quarterly. “We suggest it’s a false tradeoff. You can have a multiplicity of ideas and values and also have cultural alignment on those ideas and values.”

A new way of thinking about cultural diversity

The paper defines a new way of thinking about diversity in organizations and reconciles a fundamental contradiction in current thinking. On the one hand, deep differences in how people think can create problems when they have to coordinate on tasks; research has found that a strong and unified culture increases productivity and efficiency. On the other hand, diverse viewpoints and perspectives can help people respond to change and uncertainty, and ultimately recombine ideas into something novel.

To get a more nuanced view of the cultures of different organizations and their relationship to business performance, Srivastava and collaborators Amir Goldberg of Stanford and Matthew Corritore of McGill drew on the power of the Computational Culture Lab, which Srivastava and Goldberg co-direct. The joint Berkeley-Stanford lab uses data science to develop new ways of measuring organizational culture. (Srivastava, Goldberg and co-researchers previously analyzed 10 million internal emails from a technology company to learn about culture fit within an organization.)

This time they looked at differences between organizations, turning to Glassdoor, a job search platform with 17 million monthly users who post anonymous reviews of their employers. The company has a data science team that agreed to share data with the research team to gain new insights.

The power of machine learning

The researchers used natural language processing and machine learning to identify hundreds of topics in comments about company culture—ultimately choosing 500 topics to cover as wide a range as possible. After “training” their statistical model to identify patterns in culture-related sentences, they scanned over 500,000 reviews of 492 S&P 500 firms posted between 2008 and 2015. They matched companies with similar characteristics for purposes of comparison, limiting the sample to companies with at least 25 reviews.

By looking at how many topics were mentioned in reviews of each company, how many times they were mentioned, and how much commonality there was between reviews, they were able to determine whether a company’s culture was diverse or uniform, and divided or aligned.

For example, they classified a company as divided when they found little overlap in topics mentioned by reviewers—as might happen at a company where customer service reps prioritize delivering “wow,” but engineers care only about technical progress, and the finance team is laser-focused on profits. They found other companies where everyone talked about the same few topics: They were culturally unified, but had little diversity.

It was the companies in which employees, on average, talked about many different culture-related topics that seemed to hit the sweet spot for innovation. That kind of diversity was strongly associated with a higher market valuation—as measured by Tobin’s Q. Those firms also produced more patents on average, as well as higher-quality patents that were built on by other companies, than similar firms where the typical employee mentioned relatively few topics related to culture.

Conversely, the researchers found that firms with highly divided, rather than unified, cultures were less profitable: those types of cultures were associated with lower returns on assets (ROA).

Diversity of values, distribution of values

Interestingly, these statistical relationships were true no matter which specific values were mentioned (e.g. collaboration, adaptability, playfulness). The important factors were the variety of culture-related topics discussed and how consistently people mentioned those topics throughout the organization.

The paper suggests that in assessing a company’s culture, it’s important to look beyond which values are emphasized to how they are distributed in a group. While diversity may arise from differences between people—which the researchers call “interpersonal diversity”—it’s also true that individual people often hold multiple values, which may even be contradictory. They define this as “intrapersonal diversity.” This view builds on research that finds when people have a broad “toolkit” of cultural resources, they have greater capacity for creativity and adaptability.

New technique for measuring culture

In addition, the power of data science and natural language processing offers an exciting new way for organizations to understand what makes for a successful culture. Traditional approaches such as collecting demographic information like age, gender, or ethnicity may or may not relate to underlying beliefs, and surveys are not only expensive but also relatively static. This approach allows researchers to examine topics that people are actually talking about and how these topics vary over time.

“This gives us a much more granular measure of culture over time,” said Srivastava, who also co-leads the Berkeley Culture Initiative, which he founded with Prof. Jennifer Chatman to develop new approaches to organizational culture research.

Srivastava cautions that a limitation of Glassdoor data is that people are writing for an external audience, and they choose to write reviews for a complicated set of reasons—including in response to campaigns by their employers. To the extent possible, the researchers did account for these dynamics in their analyses, he said.

Why women can’t negotiate away the gender pay gap

To mark Equal Pay Day, we’re featuring new work by Prof. Laura Kray, an expert on gender and negotiations, along with Margaret Lee, a postdoctoral research fellow with the Center for Equity, Gender, and Leadership. Equal Pay Day was created in 1996 by the National Committee on Pay Equity to mark extra days that American women would have to work, on average, to earn what male counterparts earned last year.

Why women can't negotiate away the gender pay gap

Professor Laura Kray has doubled down on helping women develop ace negotiation skills: She’s spent much of her career studying gender dynamics in negotiations, and has also taught many hundreds of MBA students and seasoned women executives how to negotiate like pros.

Laura Kray
Prof. Laura Kray

But when it comes to strategies to close the stubborn pay gap that has women earning about 80 percent of what men earn (a statistic that varies by race/ethnicity and how it’s measured), she takes issue with telling women they can simply negotiate their way out of it. That not only puts the onus on women rather than the systemic issues that keep their salaries low, but it perpetuates stereotypes that may not be true, she said.

“We know that people who negotiate get more than those who don’t, but that’s not a ‘women’s issue’—two-thirds of men don’t negotiate,” said Kray, the Warren E. and Carol Spieker Chair in Leadership. “Women are asking, but they’re not always getting what they ask for, and they’re more likely to be told things that aren’t true.”

Kray has long peeled back the surface to look at the deeper structural issues that lead to gender inequality, from implicit bias to lack of transparency to inflexible mindsets. Recently, she’s uncovered a new front in the pay gap battle: team size. Kray and Margaret Lee, a postdoctoral research fellow sponsored by the Center for Equity, Gender, and Leadership (EGAL), are examining how deep-seated biases about leadership may lead to men being put in charge of larger teams than equally qualified women, and being paid more because of it.

Since supervising more people can be more work and indeed justify a higher salary, it’s important to unravel the reasons why men manage larger teams and how that drives higher salaries, she said. Combined with other findings, this new line of research offers another layer of insight into the causes of the gender pay gap—and possible solutions.

“We’re most interested in the structural issues, and the psychological processes of decision makers that produced them,” Kray said, at a recent EGAL presentation on her work with Lee.

Do women ask—and do they get?

Kray points to a 2017 study by McKinsey & Co. and Lean In that asked 70,000 respondents across 222 companies whether they had asked for a raise or negotiated for a promotion. While the percentages varied slightly by race, there were no significant differences between men and women overall.

She and Lee took a closer look at how this plays out among Berkeley Haas MBA students. Analyzing the results of a negotiation exercise completed by 346 MBA students who were asked to structure their own job offer, she found that the women did not sell themselves short, and asked for virtually identical base salaries as men.

In a more disturbing finding from a 2014 paper, Kray looked at the results of a sales negotiation exercise completed by pairs of 298 MBA students, where one acted as seller and one as buyer, with opportunities to lie or misrepresent the truth. Men reported they had lied to female partners in 24 percent of cases, versus just 3.4 percent of negotiations with another man—in other words, seven times as often. And although women reported lying less overall, they also were slightly more likely to lie to other women as to men.

Based on that and other experiments in the paper, Kray concluded that female negotiators are perceived as less competent and more gullible than male negotiators, which leads to them being lied to or manipulated more often—another reason why she believes the problem goes far beyond teaching women to negotiate.

“In this classroom simulation, MBA women were not getting the same treatment in negotiations, regardless of whether they were asking or not,” Kray said. “It’s important to explore if—and how—this plays out in organizational contexts.”

Team size and salary

In their new work, Kray and Lee looked at the results of a Berkeley Haas alumni survey of almost 2,000 full-time professionals who graduated between 1994 and 2014. Respondents had between two and 18 years post-MBA work experience, with an average of seven years. The researchers found that while men’s base salaries were about 8 percent higher than women’s, it’s in the extras—bonuses, share values, and options, which tend to not be tracked as publicly as salaries—where the men’s salaries dwarfed the women’s. These MBA women’s overall compensation averaged about $290,000, or about 66 percent of men’s $439,000 average.

That echoes findings from a recent study by the Forté Foundation, revealing that the salary gap is even higher for MBA women than for women overall (and highest for minority women), and that it only increases with seniority. A 2010 study of Chicago Booth MBA grads found a similar result: thirteen years out, women earned 56 percent of what men earned overall (they traced a large part of that to the career interruptions of motherhood, but found at least 10 percent of it to be unexplained).

Analyzing the Berkeley Haas alumni survey, which contained information on direct reports, Kray and Lee became interested in whether team size is contributing to pay disparities.

They compared the number of subordinates men and women reported managing and found men averaged 11 direct reports while women averaged six. After controlling for multiple factors such as experience and industry, that was reduced to an average of 10 for men and slightly less than 8 for women, but still significant. They then conducted further analysis parsing out team size from salary, and concluded that team size did account for a portion of the pay gap—above and beyond other individual job characteristics.

The researchers then delved further into why men are given larger teams. They conducted surveys of Berkeley Haas undergraduates, and also of subjects recruited through an online platform, and found no differences in men’s and women’s preferences on the number of people they’d feel comfortable managing. Even so, both groups said they preferred male managers for large teams, and female managers for smaller teams.

In another study, they found that people were more likely to associate stereotypically male attributes (e.g. assertive, forceful, aggressive, demanding) with leaders of larger teams, and associate stereotypically feminine attributes (e.g. patient, polite, kind) with leaders of smaller teams. They also found that people do believe that leaders of large teams earn more than leaders of small teams.

Kray and Lee are now more deeply pursuing research on why a team-size bias exists—based not only on stereotypes of who is a more appropriate leader but also on how complex and challenging the jobs of leading teams of various sizes are believed to be. The ultimate goals is to examine how implicit biases about team size justify part of the difference in men’s and women’s pay, and especially the gap that widens with seniority.

What can women do?

In the meantime, Kray—who also serves as faculty director for EGAL—advises women entering a job negotiation to pay close attention not only to their salary and bonuses, but also to how many direct reports they’ll be managing.

“For women who are aiming to maximize their earnings, it is important to make sure they have the headcount to justify what they’re asking for,” she said. “My advice for these aspiring women is: Don’t overlook team size as a factor that could make a difference in your paycheck, especially in the long run.”

EGAL Founding Director Kellie McElhaney said Kray and Lee’s new research is exactly the type of work she wanted the center to support when it launched in 2017.

“This works on two critically important paths: Dispelling long-held and damaging myths that are used to justify inequitable behavior, like unequal pay, and introducing new explanations that need further research, like team size,” McElhaney said.

Blockchain in bloom: New initiative drives research grants, incubator, courses

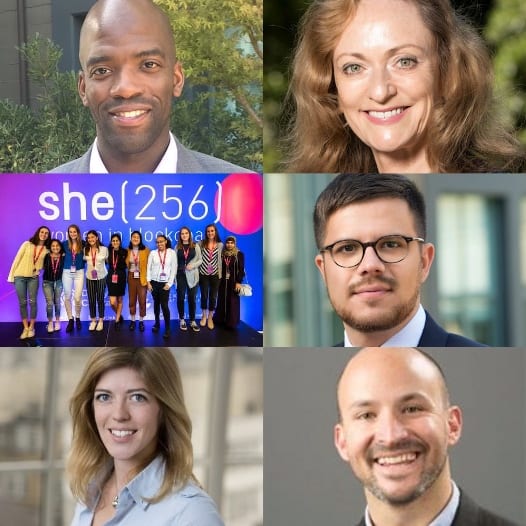
Clockwise from top left: Bosun Adebaki, MBA 19, Karin Bauer, program manager for the Berkeley Haas Blockchain Initiative, high school students attending a She256 event, Asst. Prof. Giovanni Compiani, Kate Tomlinson, MBA 20, and Adam Sterling, executive director of the Berkeley Center for Law and Business.
Clockwise from top left: Bosun Adebaki, MBA 19, Karin Bauer, program manager for the Berkeley Haas Blockchain Initiative; Asst. Prof. Giovanni Compiani; Adam Sterling, executive director of the Berkeley Center for Law and Business; Kate Tomlinson, MBA 20,  and high school students attending a She256 event.

Bosun Adebaki, MBA 19, will spend time this spring researching the merits of Central Bank Digital Currency (CBDC), a form of digital money that’s being tested by governments and central banks worldwide. His goal is to determine how central banks can use digital currencies to become more competitive, flexible, and efficient.

Adebaki, a fellow with the Berkeley Blockchain Xcelerator, is among eight graduate students and seven faculty members from across UC Berkeley who received the first round of grants from the Berkeley Haas Blockchain Initiative, a new program funded by a grant from blockchain industry leader Ripple.

“We’re moving quickly to become a hub for all of this innovation that we believe will lead to new research discoveries and technologies that seek to solve the world’s most pressing business and societal problems,” said Karin Bauer, program manager for the Berkeley Haas Blockchain Initiative.

Ripple chose Haas last June as a partner in its $50 million University Blockchain Research Initiative (UBRI), an effort that has expanded to include 29 prestigious universities around the world. Haas received a multi-year, multi-million-dollar grant to support research in blockchain, cryptocurrency, and digital payments. The Berkeley Haas Blockchain Initiative is housed in the Institute for Business and Social Impact (IBSI) at Haas and reaches across all of UC Berkeley.

A global research network

Laura Tyson
Laura Tyson, faculty director of IBSI and former Haas dean

“It’s exciting to watch the Ripple UBRI Partnership gather momentum at Haas and across the Berkeley campus,” said Prof. Laura Tyson, faculty director of IBSI and former dean of the Haas School. “Individual companies and researchers can only accomplish so much. But by supporting a research network that spans across so many great universities and over five continents, Ripple is building a powerful program that could lead to important advances for not only the entire sector, but for the world.”

Blockchain, originally developed to securely and transparently record transactions involving bitcoin and other cryptocurrencies, has become one of the hottest areas in business because it represents a fundamentally new way of handling large volumes of sensitive data. Blockchain keeps encrypted records in widely scattered networks of devices, and its advocate say it’s less vulnerable to manipulation and fraud, and is well suited for delicate operations such as money transfers and title searches.

The Berkeley Haas initiative is supporting pioneering academic research to examine the changes these technologies are bringing to a wide range of industries and the financial system, and also how they might be harnessed to reduce poverty and enhance the greater good. In addition to awarding research grants, the initiative is partnering on the new Berkeley Blockchain Xcelerator, a  joint venture of Berkeley Engineering’s Sutardja Center for Entrepreneurship & Technology, the Haas School, and Blockchain at Berkeley to incubate blockchain startups. In addition, the initiative has a pool of funds to distribute to students organizing blockchain-themed events, such as speaker series and conferences.

“Ripple’s generous gift to Haas is in recognition of our ability to drive innovation and inspire research collaboration across different professional schools and programs at UC Berkeley in blockchain, cryptocurrency, and digital payments,” Bauer said.

Fifteen research grants awarded

The first round of grants went to professors from Berkeley Engineering, the School of Information, and Haas, as well researchers from the Berkeley Center for Long-Term Cybersecurity and the Simons Institute for the Theory of Computing. Haas Prof. Paul Gertler received funding for research focused on adoption of digital payment systems by small businesses in emerging markets, and Asst. Prof. Giovanni Compiani received a grant to study what drives demand for cryptocurrencies among both individual and institutional investors. Blockchain courses taught by Adam Sterling, executive director of the Berkeley Center for Law and Business, and Ikhlaq Sidhu, chief scientist and faculty director of the Sutardja Center for Entrepreneurship and Technology, also received grants.

Eight students from Berkeley Law, Berkeley Engineering, the School of Information, the Department of Economics, and Haas each received smaller grants that will allow them to complete research projects within a semester.

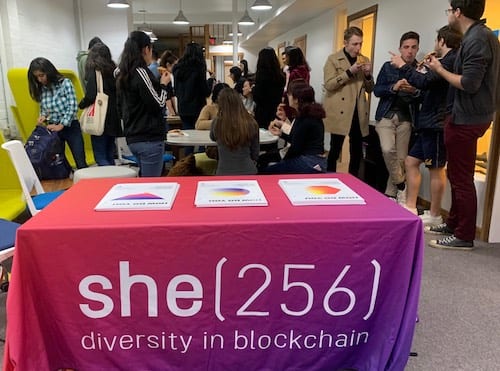
She256 advocates for diversity in blockchain.

Haas students participating, in addition to Adebaki, include Kate Tomlinson, MBA 20, and a business consultant for Blockchain@Berkeley, who will be researching applications of blockchain within the energy sector. Her project will dive deeper into the specific challenges of financial reconciliation, hardware integration, and data sharing as they apply to the energy sector. Lauren Fu, MBA 19, will research ways to assign vehicle accident liability by collecting and storing accident data using blockchain—so that the data collected will be auditable and tamper-free.

She256, co-founded by Sara Reynolds, BS EECS 21 and a Blockchain@Berkeley consultant, also received a grant to continue to develop the reach of the organization, a movement to increase diversity and break down barriers to entry in the blockchain space. The annual she256 conference will be held on Sunday, April 28, at Haas.

Supporting the Berkeley Blockchain Xcelerator

The Berkeley Haas initiative is also providing entrepreneurship training for teams accepted into the brand new Berkeley Blockchain Xcelerator, funded by the Berkeley XLab. The Xcelerator provides money, mentorship, and resources to teams building blockchain enterprises.

Neeraj Goyal, MBA 19, and Ije Anusionwu, MBA 20, wanted to use blockchain to help refugees track and sell valuables that they leave behind when they are uprooted. The pair have applied for a grant through the Xcelerator program to help build a startup based on the idea. (Grants will be announced this spring.) “Capital will be important, but we also need the expertise of people who have founded companies successfully,” said Goyal.

Working with the Sutardja Center on blockchain makes sense, says Rhonda Shrader, executive director of the Berkeley Haas Entrepreneurship Program. “We teach complementary skills that are critical for commercializing any technology,” said Shrader, who will teach courses through the program. “At Haas, we take what we know about business management and apply it to frontier technologies in a systematic and methodical way. Cooperating with Berkeley Engineering on projects large and small is what Haas students want.”

Culture club: Top scholars and execs meet at Haas to discuss why culture counts

University of Maryland Prof. Michele Gelfand_Berkeley Haas Culture Conference
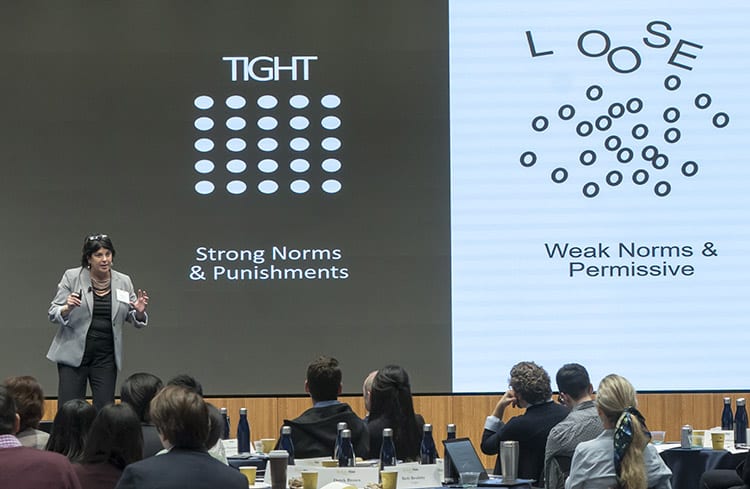
Michele Gelfand, a University of Maryland psychology professor, presents on her work examining “tight” vs “loose” cultures at the inaugural Berkeley Haas Culture Conference.

More than 100 senior business leaders and top scholars from around the world gathered at the Haas School last week to kick off the Berkeley Haas Culture Initiative, which will explore the role of culture and its impact in and across organizations.

The inaugural event was a two-day conference that brought together executives from Facebook, Netflix, Zappos, Pixar Animation Studios, Deloitte, Maersk, and other “culture-aware” companies with academics from a wide range of disciplines, including economics, anthropology, sociology, and psychology.

Jennifer Chatman and Sameer Srivastava

The initiative is the brainchild of Prof. Jennifer Chatman and Assoc. Prof. Sameer Srivastava of the Haas Management of Organizations Group, who aim to build a community of researchers and practitioners interested in how culture affects everything from hiring to promoting to the bottom line of corporate performance and strategic success.

“We invited a set of organizations that are already devoted to thinking about culture and asked them to explain the problems they are having on the ground, and we invited top academics to offer up a set of approaches to studying culture,” said Chatman. “What we are interested in is developing a shared research agenda to address some of the challenges we haven’t yet been able to solve.”

Launching the Berkeley Haas Culture Initiative

The Berkeley Haas Culture Conference was the first in what Chatman and Srivastava say will be an ongoing series of events, interdisciplinary research collaborations and industry partnerships, as well as communication exchanges on best practices. The idea was to start by taking stock of a field that has become increasing fragmented as it has expanded, Srivastava said.

“Economists study culture, psychologists study culture, and sociologists study culture—all in different ways,” Srivastava said. “At the same time, companies are developing innovative practices related to culture, and it’s often hard to disentangle what works and what doesn’t. We wanted to bring everyone together to start a conversation.”

Berkeley Haas Dean Ann Harrison

Haas Dean Ann Harrison welcomed conference attendees by highlighting the school’s commitment to its own distinctive culture.

“You don’t have to be here very long to realize that we at Haas believe that our culture is what really sets us apart,” she said. “If we ask our students why they chose to come here, most say ‘We came here because of the culture.’ And they all refer to our Defining Leadership Principles.”

UC Berkeley at the center of organizational culture research

Attendees noted that UC Berkeley has long been a leader in the study of organizational culture. “It’s really appropriate to have a conference like this here at Berkeley,” said Michael Morris, a cross-cultural psychologist and professor of management at Columbia University. Much of the classic work on organizational culture and cultural sociology came out of the university, he said.

Chatman and Charles O’Reilly, a Haas professor emeritus now at the Stanford Graduate School of Business, are pioneers in the field (both are Haas PhD alumni). Influential work has also come out of Berkeley’s anthropology, sociology, and psychology departments. More than two dozen Berkeley faculty members—including a dozen from Haas—were among those in attendance at the conference.

Prof. Chatman presenting her work.
Prof. Chatman presented on how to measure culture.

New data, new methods

Over two days, more than 100 invited attendees tackled a breadth of issues around organizational culture. Academics described their latest research with an emphasis on how data and new research methods, such as using computational approaches and unobtrusive culture measures of culture, are opening up opportunities for companies to better understand how their overall culture—and subcultures within departments or teams—affect their organizations.

For example, researchers are analyzing words used in employee emails for signs of cultural fit among individuals. They can use apps to unobtrusively capture group conversations or obtain video from body cameras. They’re also looking at historical data, such as folklore in pre-industrial countries, to better understand modern social norms. Social media platforms such as Glassdoor, too, have become a rich source of data.

“What is amazing about the papers presented here—and what is very different from 20 years ago—is the quality of the research, the use of lab and field studies, the use of archival data and ethnographies, and the use of sophisticated measurement techniques,” O’Reilly said.

Challenges on the ground

Bethany Brodsky of Netflix
Bethany Brodsky of Netflix discussed the company’s distinctive culture.

For their part, company speakers spoke candidly about the challenges around culture they are confronting as their businesses evolve, whether through mass hiring, mergers, new business strategies, or changes in leadership.

“Every time we add employees or a group of employees, our culture shifts,” said Inyong Kim, the vice president of employee experience at Adobe, who described how and why the company abolished formal performance reviews in favor of the “ongoing check-in.”

Ever-changing cultures was a theme echoed by others. For Deloitte, the question of how to transition a 150-year-old company for the future meant embracing “courage” as a key cultural value and embedding the attribute throughout the firm, said Jen Steinmann, Deloitte’s chief transformation officer. “Our three tenets of culture are the need to speak openly, support one another, and act boldly,” she said.

Bethany Brodsky, VP of talent for Netflix, talked about the enormous challenges that came with the company’s massive hiring spree after it launched simultaneously in more than 130 countries three years ago.

Grail CEO Jennifer Cook

“When you have all these new people, how do you transmit [your] culture?” asked Brodsky. A word like “feedback,” she noted, doesn’t always translate. “It Russian, it translates closest to ‘criticism,’” she said.

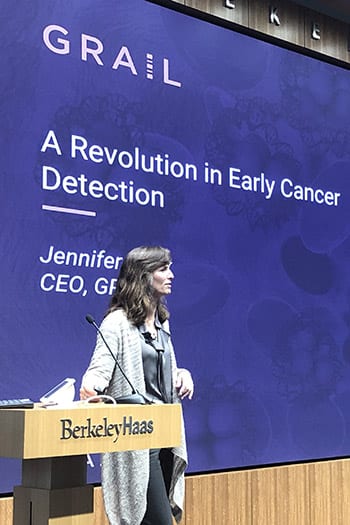
Jennifer Cook, MBA 98 and the CEO of cancer detection startup Grail, said her experiences at six companies of varying sizes over 15 years have taught her that culture is a key leadership tool. “What I’ve realized in looking back is that there were any number of organizational themes and challenges that I had faced, and our teams had faced, for which culture was the relevant solution,” she said.

Seeds of a shared agenda

Bob Gibbons, a professor of organizational economics at MIT’s Sloan School of Management, said he is pleased that the culture initiative’s goals match his own agenda of nudging his field in an applied direction. In his case, that means addressing the question of “How can an economist help a fixed set of people collaborate better together?”

“People in the world know that culture is a thing and that it matters, and they are looking to us for help,” he said. “There’s an enormous academic opportunity, and it’s super important to do it across a whole bunch of disciplines that are represented in this room. I loved hearing that part.”

Founding sponsors of the Berkeley Haas Culture Initiative include Goldman Sachs, Adobe, Deloitte, Maersk, Spencer Stuart, and the UC Investments Office.

Assoc. Prof. Sameer Srivastava


Stock options worth more for women, senior managers, study finds

Stock options worth more for women_berkeley haas study

A novel new way of determining the value of employee stock options has yielded some surprising insights: Options granted to woman and senior managers are worth more because they hold them longer. And options that vest annually rather than monthly are worth more for the same reason.

The new valuation method, which combines standard option theory with real-world observations of what employees actually do with their grants, gets at a knotty problem: Even though stock options are one of the most common forms of compensation, companies don’t really know how much granting options costs them.

Berkeley Haas Prof. Richard Stanton
Richard Stanton

“We’ve come up with a practical method of valuing stock options that takes into account actual behavior of employees,” says Richard Stanton, a Berkeley Haas professor of finance and real estate who holds the Kingsford Capital Management Chair in Business.

The new approach is laid out in “Employee Stock Option Exercise and Firm Cost,” forthcoming in the Journal of Finance and co-authored by Berkeley Haas Prof. Nancy Wallace and New York University Assoc. Prof. Jennifer N. Carpenter. Their analysis also draws on behavioral economics, which considers the effects of psychology on financial decisions.

A behavioral economics approach

Nancy Wallace
Nancy Wallace

Among their original findings: Options awarded to women cost companies 2 to 4 percent more than those granted to men, who tend to exercise their options faster. And awards to the most senior employees cost 2 to 7 percent more than grants to their lower-ranking colleagues—again, because the execs hold onto them. In addition, options cost companies significantly more when they are set up to vest less frequently—that is, reach the threshold date when they become eligible to be exercised. A shift from an annual to a monthly vesting date reduces option value by as much as 16 percent because people exercise the options earlier and more often.

According to a recent survey by Meridian Compensation Partners, 42 percent of companies responding reported they awarded stock options to senior executives. And options represent more than 20 percent of CEO pay, according to one estimate. Options allow holders to buy a specific stock at a set price until a predetermined expiration date. The basic challenge in determining the cost of employee stock options is that their value depends on how long they are kept. In general, the longer they are held, the greater the cost to the company that issued them. Consequently, the key to valuing them is to predict accurately when they will be exercised. “How much the options are worth depends on what the employee is going to do with them,” Stanton notes.

A vast literature examines how to determine the value of stock options traded on exchanges. But employee stock options are a special breed with their own special characteristics. For that reason, the valuation methods originally developed for exchange-traded options are imprecise when applied to the options companies award their employees. 

Standard option theory takes into account several factors to forecast when options will be cashed in. But it was largely developed through studies of exchange-traded options, making it out of whack for employee stock options for several reasons. For one, employee stock options can’t be traded on the market—the only way employees can dispose of them is to use them to buy the underlying stock. Second, they can only be used during a multi-year window that starts when they vest and ends when they expire. Third, employees can’t easily protect themselves from the risk of having so much of their wealth tied to their employer’s stock, since the only way to reduce the risk is to exercise the option, and that impacts its value.

New model factors in behavior and risk

To arrive at a more accurate way of estimating when employees would exercise stock options, Stanton, Carpenter, and Wallace, the Lisle and Roslyn Payne Chair in Real Estate Capital Markets, analyzed a unique set of data that included complete employee stock option histories awarded to some 290,000 employees from 1981 to 2009 at 88 publicly traded corporations. The dataset gave them an unprecedented fine-grained look at option-exercise behavior. The authors then constructed a mathematical model of exercise rates that took relevant factors from standard theory and added factors related to the riskiness of the options, based on portfolio theory, along with some additional behavioral factors and information on the terms governing options grants, along with characteristics of issuing companies and option holders.

Their findings included some surprises. For example, vesting frequency had an especially powerful effect on option cost. The obvious reason is that employees are able to exercise options earlier when they vest more frequently. But something else may be at work—employees receive an email when options vest, which may prompt them to pull the trigger.  “When people’s attention is drawn to their holdings, they’re more likely to make a decision,” Stanton suggests. Similarly, men may exercise options earlier and more often than women because they are more confident making financial decisions. That finding is in line with influential work by Berkeley Haas Prof. Terrance Odean, who found that male investors trade more frequently than women—behavior that reduces their net returns.

But why do high-ranking employees hold their options longer than lower-ranking colleagues? One reason may simply be that they are wealthier and don’t need a stock options windfall to pay for a home renovation or an expensive vacation.

Almost ten years in the making, the research was funded by the Society of Actuaries in response to regulatory calls for improved employee stock option evaluation methods.


More from these researchers

Minority homebuyers face widespread lending discrimination

A decade after housing bust, mortgage industry is on shaky ground, experts warn

Nancy Wallace named chair of the Fed’s model validation council

A house of cards: Prof. Nancy Wallace warns of risk in real estate securities


The more the merrier: new research shows donors prefer to spread their dollars around

New Berkeley Haas research finds people like to spread donations around

It’s that time of year when inboxes and mailboxes are flooded with pleas from a parade of worthy causes—from fighting hunger overseas to aiding victims of the latest natural disaster to funding your local library. Faced with so many needs, do you spread your donation dollars around, or focus on one cause to maximize your impact?

If you’re like most people faced multiple requests for help, you’re likely to divide your donations among requesters because it feels more fair, according to a new Berkeley Haas study. The upshot? You may end up giving less to each requester, but more overall, the study found.

Berkley Haas Asst. Prof. Juliana Schroeder
Juliana Schroeder

The paper, co-authored by Berkeley Haas Asst. Prof. Juliana Schroeder and PhD student Daron Sharps and forthcoming in the Journal of Personality and Social Psychology, offers new insights into how people give help. The results could help groups seeking the best strategy to maximize donations.

“People seem to be primarily driven by fairness concerns when allocating help, and when people see more individual requesters, they give more,” said Schroeder, a psychologist in the Haas Management of Organizations Group who studies social interactions and previously looked at how donors give different kinds of help to people they view as less competent. “That was surprising to both of us, since it seems to contrast with the ‘identifiable victim effect.’”

Identifiable victims

That effect is the tendency people have to offer more help to a single, identifiable person with a compelling need than to a large, vaguely defined group such as “earthquake victims”—a phenomenon leveraged by every charity sharing heart-tugging stories and photos. It’s also been found that people don’t tend to give more to larger groups, even though the need is greater: one study by Nobel Prize-winning psychologist Daniel Kahneman found that people will give the same amount to a group of 2,000 as to 200,000.

Daron Sharps_Berkeley Haas PhD student
Daron Sharps

Yet prior studies did not look at whether people were considering each request separately—a psychological phenomenon known as “unpacking”.

“We know that you might get more donations for ‘Tommy’ who was affected by the earthquake than for a million people who were affected by the earthquake, but what about ‘Tommy’ compared with ‘Tommy, Ana, and John’?,” said Sharps, who served as lead author on the study. “We found the important part is the identifiable nature of the recipient, not that it’s one versus many requesters.”

A clear pattern

The researchers studied giving behavior across nine experiments involving 3,100 people, most of whom were recruited through an online platform. They found a clear pattern: When given a choice of how to allocate donations, almost 80 percent of people chose to distribute funds across multiple recipients, with the majority giving some to every requester—and half of those distributing funds equally (researchers only looked at up to ten requesters). Only about 20 percent of givers funneled all of their donation to one recipient.

In an initial experiment, participants were shown five real profiles of women seeking money to buy seeds for the upcoming farming season via Kiva.org—an online platform that allows people to lend money to low-income entrepreneurs in 80 countries. The participants were asked how they’d distribute $100. People not only preferred to spread the money among all the women, but rated that strategy as the fairest.

“People would rather give $10 each to 10 people than choose four people to give them $25 each,” said Sharps.

Deciding what’s fair

Even when people were presented with requesters with different levels of neediness, they tended to give more to those with greater needs but still thought it was most fair to distribute the money rather than concentrate on one needy person. When asked how they’d divide funds between women who were all trying to raise $600 for business equipment—but were starting out with unequal amounts from $100 to $400—just 16 percent of donors chose to give everything to the neediest requester, while 81 percent distributed funds among all the women. What’s more, only 4 percent split up the money so that the women ended up with the same amount of funding.

Having worked in philanthropy earlier in her career, Sharps said she was surprised that so many people chose breadth over depth, and that they paid more attention to distributing their donations equally than to equal outcomes. “Making an impact was a very important part of what we thought about in the world of philanthropy, and concentrating donations would seem to make a greater impact in some cases,” she said. “But people were more focused on allocating their help fairly than on the requesters’ actual outcomes.”

When asked about their motivations in one of the experiments, participants said that dividing funds equally was not only more fair, but was also more impactful and efficient, would be more appreciated, and would leave helpers with less guilt. A further analysis by the researchers found that only participants’ beliefs about fairness—rather than impact or efficiency or other motivations—statistically predicted their choice to distribute donations. This indicates that fairness may be the primary psychological driver of decision to distribute help, the authors concluded.

More requests = more giving

In another set of experiments, the researchers used real profiles from various online platforms that featured people as well as pets in need of medical care or support. The participants were given small amounts of real money to donate—some were told they had to donate it all, but in other cases were told it was optional and they could keep what they didn’t donate.

Whether the donations were optional or mandatory, people spread the money around. For those who were told their donations were optional, the total amount they donated increased with the number of people or animals to which they could donate. People were just as likely to distribute donations to two requesters as to ten requesters—although they gave less per requester as the number increased.

In another scenario, one group of participants was shown profiles of four pets and asked to consider donations to each of them, while another group was asked to donate to the “Pets in Need” charity to support the same four animals. Those who considered the animals separately gave more overall. Researchers found the same outcome when people were asked to donate polio vaccines to five individual children versus a group that would vaccinate five children—they gave more to the five individual children than to the group.

This finding has several implications for organizations, Sharps said. Charities might consider ways to bring in the stories of multiple people into their donation appeals, and ask people to consider each one individually, rather than lumping them together. They might also find ways to amplify fairness concerns—such as a message for donors before they leave the page: “Are you sure you want to leave this person unhelped?”

“People don’t like to feel like they’re leaving some needy requesters unhelped,” Sharps said.

Real estate & economics forecast: a recession is on the horizon

San Francisco skyline: A recession is on the horizon

Unemployment is at its lowest rate in 50 years, there are almost 7 million job openings nationwide, and consumer confidence is at its highest level in a decade. There’s more venture capital flowing than at any point since 2000, and commercial real estate loan origination is at its highest point ever. So, what could go wrong?

Lots, said Kenneth Rosen, faculty director for the Haas School’s Fisher Center for Real Estate & Urban Economics, who foresees a recession within the next 18 to 24 months.

“We’ve had a sugar high for the economy, and it will wear off,” said Rosen, delivering his annual forecast at the 41st Annual Real Estate & Economics Symposium in San Francisco this week.  “We’re in the last stages of a very good recovery, but we’re buying this time by spending a lot of money that we don’t have.”

Kenneth Rosen
Kenneth Rosen

Even so, Rosen does not foresee a crash in the real estate market anything like 2004 to 2007 or the late 1980s, and there’s still plenty of “dry powder”—or cash available for investment, he said. While real estate is overvalued compared to historical prices, it’s not overvalued compared to everything else, he said.

“This is not a very dramatic forecast, but the risks have risen dramatically and this is just the beginning of volatility,” he said. “There will be correction, and the Bay Area is likely to have a bigger correction than the rest of the country, because we’ve gone up so much.”

“A sledgehammer to break open a walnut”

Rosen pointed to rising interest rates, a ballooning national deficit, increasingly restrictive immigration policies in a tight labor market, and the escalating trade war with China as trouble signs. With $250 billion in tariffs imposed and $257 billion more threatened by President Trump, Chinese retaliation is to be expected.

“We certainly have problems with China, but tariffs are an exceptionally a blunt tool. It’s like using a sledgehammer to break open a walnut,” said Rosen, who is also chairman Rosen Consulting Group, a real estate market research firm. “No one wins in a trade war.”

The combined economic stimulus of tax cuts and increased spending has overheated the economy, and left few tools in policy makers’ arsenal to recover from the next recession, he said.  A gridlocked Congress would not be able to pass a spending increase bill, or another tax cut. “In a full employment economy, the deficit should be zero or positive, so we should be at a balanced budget today. We’re doing the opposite. We’re not going to be ready for the next big downturn.”

While he had plenty of critiques of President Trump and his administration, he said Congress is also at fault. “There are no fiscal hawks any more. There’s no one who believes in balanced budgets.”

Red-hot economy

In the immediate future, however, the economy remains red hot. There’s a boom in job creation nationwide, especially throughout the West. California as a whole is a bit lower than the rest of the region, but it still had 1.9 percent growth in job creation year-over-year. Unemployment in San Francisco hovers just over 2 percent.

“The tech cities are going strong: Seattle, Austin, Silicon Valley, Denver, San Francisco, and Oakland are still very strong. The only thing constraining these places is the fact that housing is so expensive that they can’t get people to come. We’d be growing faster if we can solve some of those issues.”

Real estate forecast

Nationwide, retail is still struggling while industrial properties are hot, with vacancy rates at their lowest point since the 80s. “It’s a red-hot sector because of e-commerce, which is driving the demand for this space and bypassing retail network.”

In terms of commercial real estate, Rosen predicts cap rates—or the rates of return on commercial property—are expected to rise after historic lows. He warned the crowd of 300 real estate and  finance professionals in the room to not be too smug. “We’ve had big periods of appreciation in the last decade because cap rates went down. Don’t think it’s because you’re smart—it’s because they repressed interest rates. It’s going to reverse. We’ll have headwinds.”

His advice? “As a lender, I’d say now’s the time to be cautious. Don’t lend to inexperienced people. You’ve got to be able to hold through the next six years—don’t think you’re going to miss this recession,” he said. “As an investor, it’s now is the time harvest or hedge, don’t wait for the next cycle.”

Nationally there’s strong demand for office space, but it’s nothing like previous booms. And vacancy rates have stopped going down because businesses need less space per worker—thanks to open floor plans and co-working spaces.

“The WeWorks of the world are 50 percent more dense than traditional office spaces,” he said.

Although the rental market peaked several years ago and home ownership is creeping back up, rental vacancy rates are low. The proportion of young adults living with their parents has begun to drop from a high of 32 percent in 2016. In the Bay Area, apartment vacancy rates are below 4 percent, and rents are rising again after appearing to top out.

California—a victim of its own success?

California homes have become increasingly unaffordable–just 30 percent of people can afford a median priced home, compared with 50 percent nationally. In the Bay Area, prices were up almost 10 percent year-over-year in September. Recently, however, there are signs that home prices may be beginning to drop—whether it’s due to rising interest rates or people leaving the region.

All this leads Rosen to believe California may soon be a victim of its own success.

“We may be the cause of our own demise. With high housing prices and congestion, people are going to move elsewhere,” he said. “You’ve seen reports that up to a third of people are thinking of relocating in the next five years. Add to that the higher taxes that we keep on voting on ourselves, and I think we could be in a situation where we’ve hit our peak moment and it’s just a question of how fast we can slow down.”

Minority homebuyers face widespread statistical lending discrimination, study finds

UC Berkeley study finds Minority Homebuyers Face Widespread Statistical Lending Discrimination

Face-to-face meetings between mortgage officers and homebuyers have been rapidly replaced by online applications and algorithms, but lending discrimination hasn’t gone away.

A new University of California, Berkeley study has found that both online and face-to-face lenders charge higher interest rates to African American and Latino borrowers, earning 11 to 17 percent higher profits on such loans. All told, those homebuyers pay up to half a billion dollars more in interest every year than white borrowers with comparable credit scores do, researchers found.

The findings raise legal questions about the rise of statistical discrimination in the fintech era, and point to potentially widespread violations of U.S. fair lending laws, the researchers say. While lending discrimination has historically been caused by human prejudice, pricing disparities are increasingly the result of algorithms that use machine learning to target applicants who might shop around less with higher-priced loans.

“The mode of lending discrimination has shifted from human bias to algorithmic bias,” said study co-author Adair Morse, a finance professor at UC Berkeley’s Haas School of Business. “Even if the people writing the algorithms intend to create a fair system, their programming is having a disparate impact on minority borrowers—in other words, discriminating under the law.”

First-ever dataset 

A key challenge in studying lending discrimination has been that the only large data source that includes race and ethnicity is the Home Mortgage Disclosure Act (HDMA), which covers 90 percent of residential mortgages but lacks information on loan structure and property type. Using machine learning techniques, researchers merged HDMA data with three other large datasets—ATTOM, McDash, and Equifax—connecting, for the first time ever, details on interest rates, loan terms and performance, property location, and borrower’s credit with race and ethnicity.

The researchers—including professors Nancy Wallace and Richard Stanton of the Haas School of Business and Prof. Robert Bartlett of Berkeley Law—focused on 30-year, fixed-rate, single-family residential loans issued from 2008 to 2015 and guaranteed by Fannie Mae and Freddie Mac.

This ensured that all the loans in the pool were backed by the U.S. government and followed the same rigorous pricing process—based only on a grid of loan-to-value and credit scores—put in place after the financial crisis. Because the private lenders are protected from default by the government guarantee, any additional variations in loan pricing would be due to the lenders’ competitive decisions. The researchers could thus isolate pricing differences that correlate with race and ethnicity apart from credit risk.

The analysis found significant discrimination by both face-to-face and algorithmic lenders:

  • Black and Latino borrowers pay 5.6 to 8.6 basis points higher interest on purchase loans than White and Asian ethnicity borrowers do, and 3 basis points more on refinance loans.
  • For borrowers, these disparities cost them $250M to $500M annually.
  • For lenders, this amounts to 11 percent to 17 percent higher profits on purchase loans to minorities, based on the industry average 50-basis-point profit on loan issuance.

“Algorithmic strategic pricing”

Morse said the results are consistent with lenders using big data variables and machine learning to infer the extent of competition for customers and price loans accordingly. This pricing might be based on geography—such as targeting areas with fewer financial services—or on characteristics of applicants. If an AI can figure out which applicants might do less comparison shopping and accept higher-priced offerings, the lender has created what Morse calls “algorithmic strategic pricing.”

“There are a number of reasons that ethnic minority groups may shop around less—it could be because they live in financial deserts with less access to a range of products and more monopoly pricing, or it could be that the financial system creates an unfriendly atmosphere for some borrowers,” Morse said. “The lenders may not be specifically targeting minorities in their pricing schemes, but by profiling non-shopping applicants they end up targeting them.”

This is the type of price discrimination that U.S. fair lending laws are designed to prohibit, Bartlett notes. Several U.S. courts have held that loan pricing differences that vary by race or ethnicity can only be legally justified if they are based on borrowers’ creditworthiness. “The novelty of our empirical design is that we can rule out the possibility that these pricing differences are due to differences in credit risk among borrowers,” he said.

Overall decline in lending discrimination

The data did reveal some good news: Lending discrimination overall has been on a steady decline, suggesting that the rise of new fintech platforms and simpler online application processes for traditional lenders has boosted competition and made it easier for people to comparison shop—which bodes well for underserved homebuyers.

The researchers also found that fintech lenders did not discriminate on accepting minority applicants. Traditional face-to-face lenders, however, were still 5 percent more likely to reject them.


CONTACTS & RESOURCES

Read the full paper.

Berkeley Haas Media Relations: Laura Counts, [email protected], (510) 643-9977

Berkeley Law: Prof. Robert Bartlett, [email protected]


Buy or lease? In going solar, third-party deals offer advantages

Jose Guajardo_commercial solar

When it comes to going solar, is it better to buy or lease? For businesses looking to get on the right side of climate change, choosing a provider that offers solar-as-a-service may be more efficient than buying a system outright, according to new research from the Haas School of Business.

Asst. Prof. Jose Guajardo, who has studied the operational implications of service business models in multiple industries, looked at the performance of nonresidential solar systems installed in California between January 2008 and April 2013. Analyzing data collected by the California Solar Initiative rebate program, he found third-party-owned systems enjoyed a clear performance advantage, generating a 4 percent better production yield than installations owned directly by the businesses.

“In California’s solar energy sector, this research establishes a connection between service business models and operational performance,” says Guajardo, who published his results in the Fall 2018 issue of the journal Manufacturing & Service Operations Management.

For businesses, this is no small matter: The scale of solar projects can be enormous. For example, in 2015, Apple Computer announced it was investing $850 million to help build a central California solar farm, using some of the energy generated by the project to power its Cupertino, Cal. headquarters.

Some firms, such as Ikea, are opting for direct ownership; others, such as Staples, have opted to lease. Yet while firms approach the decision based on a range of criteria, including how much they want to invest upfront, there has been little empirical evidence to help them choose between these competing business models.

Part of what makes solar so attractive is that it comes with subsidies to encourage its use: The federal government offers tax breaks, and many states offer additional incentives. California, for example, has offered performance-based subsidies to solar producers in the nonresidential sector.  In addition, power purchase agreements—in which the user pays a set rate per unit of energy generated—are commonly used by third-party ownership companies. That means the third-party owner has a double profit motive for boosting energy yield.

Better system design

Guajardo analyzed two strategies that third-party operators can pursue to improve performance: better solar panels or better system design, which means orienting equipment to make the best possible use of sunlight. He found evidence that system design, and not superior panel technology, may account for the third-party advantage. In fact, third-party owners tended to use lower-rated panels, but their better design decisions led to better performance overall.

Guajardo believes there’s a knowledge and skills gap between dedicated solar providers and businesses that run their own systems. “By installing many systems, third-party operators can benefit from learning by doing and economies of scale,” he says.

These results, Guajardo cautions, are particular to non-residential systems that received performance-based incentives in California, and may not apply in places without subsidy programs rewarding performance. He stresses, however, that service business models have been widely used not only in solar energy, but also in several other cleantech markets. Moreover, incentives for adoption of this type of technology have been common in the United States and several other countries.

When it comes to the  adoption of solar energy, Guajardo advises businesses to carefully consider how the incentives behind each ownership model can make a difference from an operational perspective.


Can racism, sexism, and other biases be quantified?

Berkeley Haas Assoc. Prof. Ming Hsu built a model to quantify stereotypesWhen a Starbucks employee recently called the police on two black men who asked for a bathroom key but hadn’t yet ordered anything, it seemed a clear-cut case of racism leading directly to unfair treatment. Many outraged white customers publicly contrasted it with their years of hassle-free Starbucks pit stops.
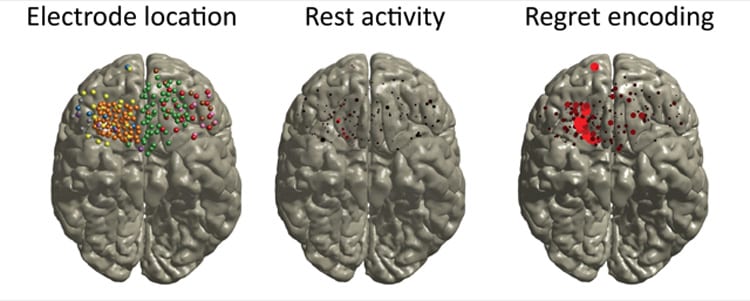
But from a scientific perspective, making a direct connection between people’s biases and the degree to which they treat others differently is tricky. There are thousands of ways people stereotype different social groups—whether it’s assuming an Asian student is good at math or thinking an Irish colleague would make a good drinking buddy—and with so many variables, it’s incredibly challenging to trace how someone is treated to any one particular characteristic.

“There is a tendency for people to think of stereotypes, biases, and their effects as inherently subjective. Depending on where one is standing, the responses can range from ‘this is obvious’ to ‘don’t be a snowflake,’” said Berkeley Haas Assoc. Prof. Ming Hsu. “What we found is that these subjective beliefs can be quantified and studied in ways that we take for granted in other scientific disciplines.”

How do stereotypes influence behavior?

Berkeley Haas Assoc Prof Ming Hsu
Ming Hsu

A new paper published today in the Proceedings of the National Academy of Sciences cuts to the heart of messy social interactions with a computational model to quantify and predict unequal treatment based on perceptions of warmth and competence. Hsu and post-doctoral researcher Adrianna C. Jenkins—now an assistant professor at the University of Pennsylvania—drew on social psychology and behavioral economics in a series of lab experiments and analyses of field work. (The paper was co-written by Berkeley researcher Pierre Karashchuk and Lusha Zhu of Peking University.)

“There’s been lots of work showing that people have stereotypes and that they treat members of different social groups differently,” said Jenkins, the paper’s lead author. “But there’s quite a bit we still don’t know about how stereotypes influence people’s behavior.”

It’s more than an academic issue: University admission officers, for example, have long struggled with how to fairly consider an applicant’s race, ethnicity, or other qualities that may have presented obstacles to success. How much weight should be given, for example, to the obstacles faced by African Americans compared with those faced by Central American immigrants or women?

Eye-opening findings

While these are much larger questions, Hsu said the paper’s contribution is to improve how to quantify and compare different types of discrimination across different social groups—a common challenge facing applied researchers.

“What was so eye-opening is that we found that variations in how people are perceived translated quantitatively into differences in how they are treated,” said Hsu, who holds a dual appointment with UC Berkeley’s Helen Wills Neuroscience Institute and the Neuroeconomics Lab. “This was as true in laboratory studies where subjects decided how to divide a few dollars as it was in the real-world where employers decided whom to interview for a job.”

The model offers a way to establish a direct connection between widely held stereotypes and entrenched societal inequities. Kellie McElhaney, founding executive director of the Center for Equity, Gender and Leadership (EGAL), said this is the kind of fundamental research that informs the mission of the center, which aims to “develop equity fluent leaders who ignite and accelerate change.”

“This research continues to advance critical knowledge and solutions around the significant and negative impact of biases, and in particular, the consequences in the business world,” she said.

Rather than analyzing whether the stereotypes were justified, the researchers took stereotypes as a starting point and looked at how they translated into behavior with over 1,200 participants across five studies. In the first study involving the classic “Dictator Game,” where a player is given $10 and asked to decide how much of it to give to a counterpart, the researchers found that people gave widely disparate amounts based on just one piece of information about the recipient (i.e., occupation, ethnicity, nationality). For example, people on average gave $5.10 to recipients described as “homeless,” while those described as “lawyer” got a measly $1.70—even less than an “addict,” who got $1.90

To look at how stereotypes about the groups drove people’s choices to pay out differing amounts, the researchers drew on an established social psychology framework that categorizes all stereotypes along two dimensions: those that relate to a person’s warmth (or how nice they are seen to be), and those that relate to a person’s competence (or how intelligent they are seen to be). These ratings, they found, could be used to accurately predict how much money people distributed to different groups. For example, “Irish” people were perceived as warmer but slightly less competent than “British,” and received slightly more money on average.

“We found that people don’t just see certain groups as warmer or nicer, but if you’re warmer by X unit, you get Y dollars more,” Hsu said.

Specifically, the researchers found that disparate treatment results not just from how people perceive others, but how they see others relative to themselves. In allocating money to a partner viewed as very warm, people were reluctant to offer them less than half of the pot. Yet with a partner viewed as more competent, they were less willing to end up with a smaller share of the money than the other person. For example, people were ok with having less than an “elderly” counterpart, but not less than a “lawyer.”

Predicting job callbacks

It’s one thing to predict how people behave in carefully controlled laboratory experiments, but what about in the messy real world? To test whether their findings could be generalized to the field, Hsu and colleagues tested whether their model could predict treatment disparities in the context of two high-profile studies of discrimination. The first was a Canadian labor market study that found a huge variation in job callbacks based on the perceived race, gender, and ethnicity of the names on resumes. Hsu and colleagues found that the perceived warmth and competence of the applicants—the stereotype based solely on their names—could predict the likelihood that an applicant had gotten callbacks.

They tried it again with data from a U.S. study on how professors responded to mentorship requests from students with different ethnic names and found the same results.

“The way the human mind structures social information has specific, systemic, and powerful effects on how people value what happens to others,” the researchers wrote. “Social stereotypes are so powerful that it’s possible to predict treatment disparities based on just these two dimensions (warmth and competence).”

Future applications

Hsu says the model’s predictive power could be useful in a wide range of applications, such as identifying patterns of discrimination across large populations or building an algorithm that can detect and rate racism or sexism across the internet—something these authors are deep at work on now.

“Our hope is that this scientific approach can provide a more rational, factual basis for discussions and policies on some of the most emotionally-fraught topics in today’s society,” Hsu said.


Regret is a gambler’s curse, scientists say

What goes through a gambler’s mind after she’s placed her bet?

It’s not just the anticipation of a big payoff, or doubts about the wisdom of her bet. It’s also regret about previous bets, both won and lost, according to UC Berkeley neuroscientists.

“Right after making a choice and right before finding out about the outcome, the brain is replaying and revisiting nearly every feature of what happened during the previous decision,” said senior author Ming Hsu, an associate professor in the Haas School of Business and Helen Wills Neuroscience Institute at UC Berkeley. “Instead of ‘I just gambled but maybe I shouldn’t have,’ it is, ‘Last round I gambled and that was a really good choice.’ Or, ‘I played it safe last time but should have gone for it.’”

Activity in the orbitofrontal cortex during a gambling experiment, as recorded by electrode meshes placed directly on the surface of the brain.
Activity in the orbitofrontal cortex during a gambling experiment, as recorded by electrode meshes placed directly on the surface of the brain. On the left, the dots indicate the positions of the electrodes in each of the 10 subjects, distinguished by color. During normal activity (middle), the electrodes (black dots) show little activity (red) in the OFC region that deals with regret. During the betting game, however (right), after learning the outcome of the bet, many electrodes record activity in the area where we feel regret (red).

The UC Berkeley study is one of a small but growing number of studies that record fast human brain activity – a thousand measurements per second – to reveal the complex array of operations underlying every decision we make, even those that may seem trivial.

Ming Hsu and Ignacio Saez at UC Berkeley.
Ming Hsu and Ignacio Saez at UC Berkeley. (Jim Block photo)

The researchers focused on the brain’s orbitofrontal cortex, long-known to be involved in reward processing and social interactions. Indeed, it was one of the main sites of damage in the well-known case involving 19th century railroad worker Phineas Gage, whose left frontal cortex was destroyed after an explosion drove an iron bar through his head. The damage altered his personality, making him impulsive and uninhibited – seemingly a man who didn’t regret any act, no matter how disastrous the outcome.

In recent decades, the orbitofrontal cortex has been shown to be involved in how people value their choice options, how much regret they felt, how much risk they were taking and how valuable their choice was, all of which guide future choices or help someone appraise how good or bad the outcome was.

As shown in this study, however, the orbitofrontal cortex spends much of the time replaying aspects of past decisions. In particular, when people play a gambling game, the main driver of activity in the orbitofrontal cortex is the regret they feel from losing or the regret, after winning, of not having bet more.

“It turns out that the most prevalent information encoded in the orbitofrontal cortex was the regret subjects experienced from their previous decision,” said first author Ignacio Saez, a former UC Berkeley postdoctoral fellow who is now an assistant professor at UC Davis.

With the ability to recognize the pattern of activity associated with regret, the findings could open the door to assessing how well the regret circuits in the brain operate in people with brain injuries or those with behaviors that suggest the absence of regret, including some politicians.

Read the full story by Robert Sanders—and try the gambling game—on Berkeley News.